[1/4] The recent observed increase in COVID-19 cases in Gauteng province is primarily due to a reporting delay for antigen test results. The case plots and metrics on the SACMC Epidemic Explorer are also affected by the reporting delay.
[2/4] Note that the Sustained Increase Monitoring plots on SACMC Epidemic Explorer are useful to interpret trends in cases over time.
[3/4] In Gauteng, the delayed data result in an uptick in cases, but the increase has not occurred consistently over a prolonged period and a “sustained increase” has not been triggered.
[4/4] It is useful to monitor case numbers via the Sustained Increase Monitoring plots on the SACMC Epidemic Explorer to determine if increases are due to reporting blips or reflect a consistent trends likely to indicate increased transmission.

• • •

Missing some Tweet in this thread? You can try to force a refresh
 

Keep Current with South African COVID-19 Modelling Consortium

South African COVID-19 Modelling Consortium Profile picture

Stay in touch and get notified when new unrolls are available from this author!

Read all threads

This Thread may be Removed Anytime!

PDF

Twitter may remove this content at anytime! Save it as PDF for later use!

Try unrolling a thread yourself!

how to unroll video
  1. Follow @ThreadReaderApp to mention us!

  2. From a Twitter thread mention us with a keyword "unroll"
@threadreaderapp unroll

Practice here first or read more on our help page!

More from @saCOVID19mc

17 Jun
[1/5] CITY OF JOHANNESBURG Update: High case incidence across all sub-districts over the last week and extremely high case numbers reported in Regions C, D, E and F; cases increasing by 62%-150% compared to 7 days prior.
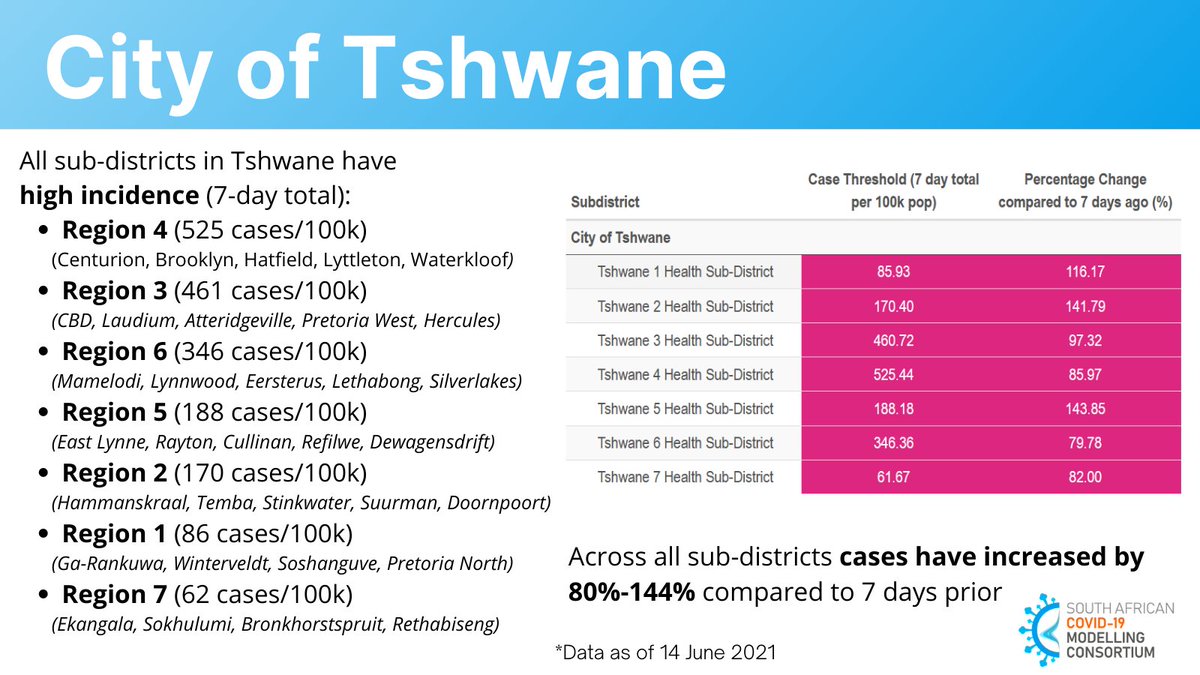
[2/5] TSHWANE Update: High case incidence across all sub-districts ranging between 62 and 525 cases per 100k pop. Increases of 80%-144% compared to the 7 days prior.

Visit sacmcepidemicexplorer.co.za to follow cases and hospitalizations in your region.
[3/5] EKURHULENI Update: All sub-districts are experiencing high case incidence, ranging between 76 and 264 cases/100k pop. Percentage change in cases ranges between 25%-124% compared to the week before.
Read 5 tweets
11 Jun
[1/4] In light of the high number of cases reported, we present an update for several provinces which have an increase in cases: Gauteng has had a 12-90% increase in daily new cases, and high case incidence (105-192/100k pop). Image
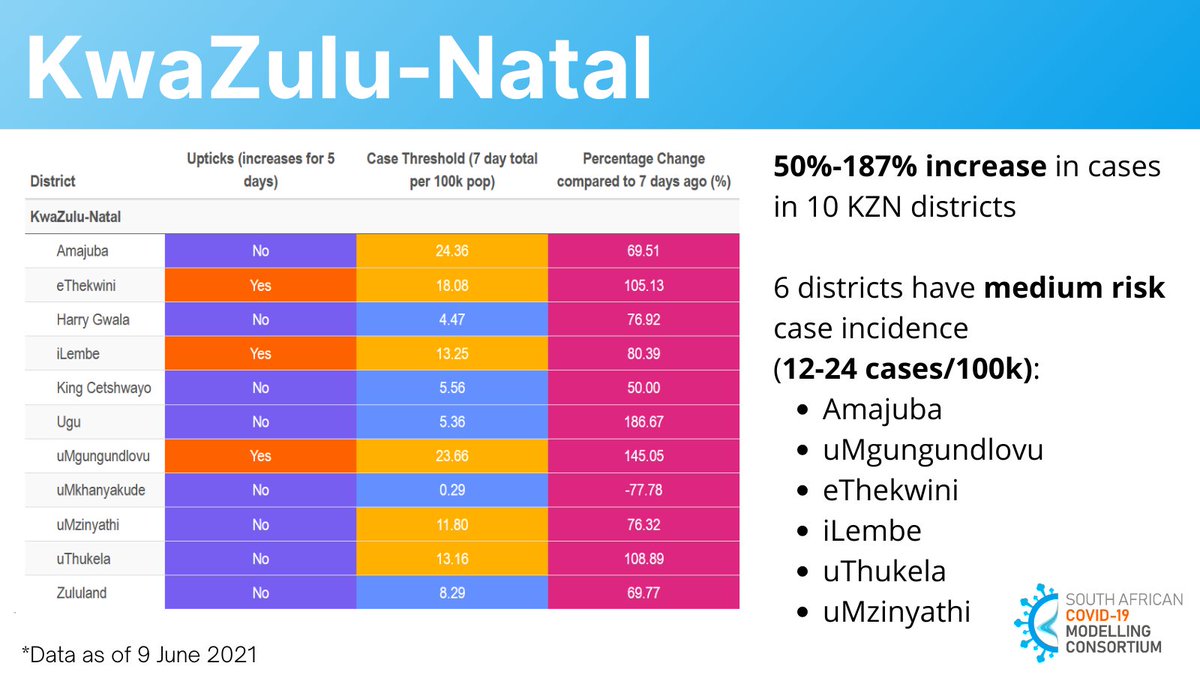
[2/4] KwaZulu-Natal, in almost all districts, has had cases increase by 50%-187% compared to 7 days prior. Six districts have a MEDIUM risk incidence (12-24 cases/100k pop). There have been upticks in eThekwini, iLembe and uMgungundlovu. Image
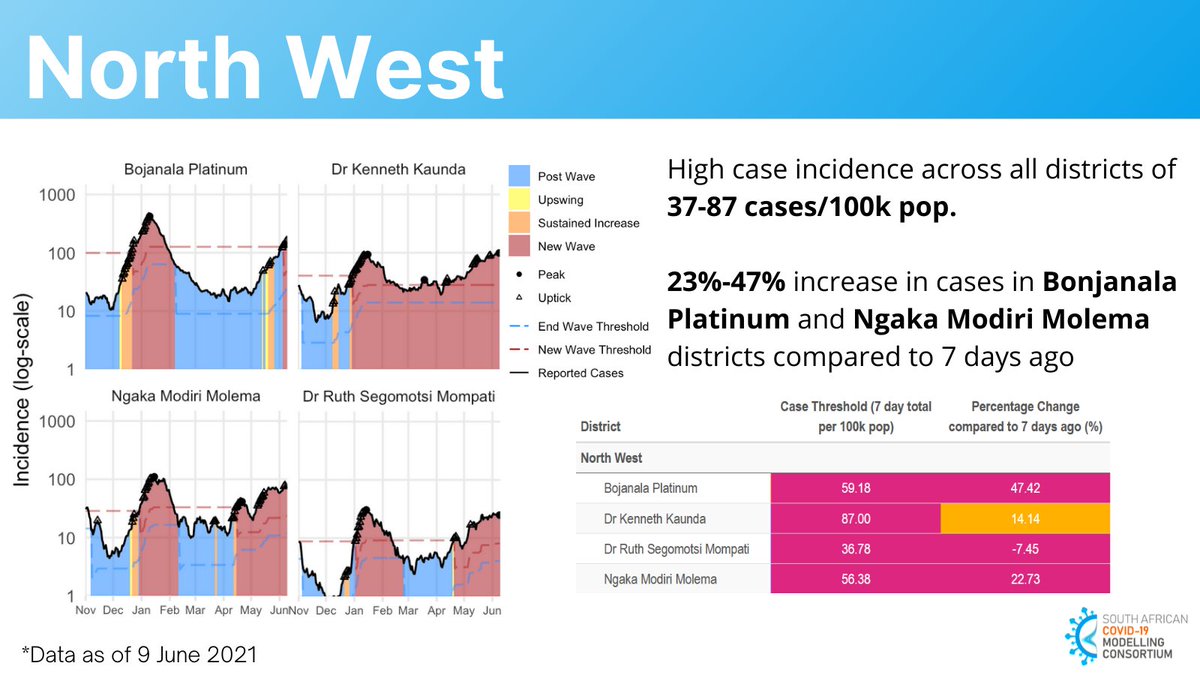
[3/4] North West province has HIGH risk incidence of 37-87 cases/100k pop, and 2 districts have an increase in cases compared to the last 7 days: Bonjanala Platrium (47%) and Ngaka Modiri Molema (23%). Image
Read 4 tweets
3 May
SACMC released a report on potential 3rd wave scenarios: buff.ly/3aYKW0X. Monitoring trends in cases, eg. on sacmcepidemicexplorer.co.za, is the best indicator of when a 3rd wave is likely to begin. [1/5]
In summary: In the absence of new variant, the peak of the 3rd wave is expected lower than the 2nd wave, and time from initial increase in transmission to peak is on average 2-3 months. [2/5]
Across all ages, hospital admissions are expected lower than in 2nd wave. Admissions in each province depend on seroprevalence after 2nd wave, age distribution and prevalence of comorbidities, individual responses to increasing case numbers and to restrictions. [3/5]
Read 5 tweets

Did Thread Reader help you today?

Support us! We are indie developers!


This site is made by just two indie developers on a laptop doing marketing, support and development! Read more about the story.

Become a Premium Member ($3/month or $30/year) and get exclusive features!

Become Premium

Too expensive? Make a small donation by buying us coffee ($5) or help with server cost ($10)

Donate via Paypal Become our Patreon

Thank you for your support!

Follow Us on Twitter!

:(