One thing that is certain to be true: the dominant choice of Minneapolis voters today is going to be “did not vote,” not any of the candidates/choices on the ballot. Since the 70s, Minneapolis has never had a municipal race where more than 50% of registered voters turned out.
And even if we do set a modern record and top 50% turnout, more registered voters will have stayed home than will vote for any of the candidates/choices.
Here’s a turnout history for Minneapolis mayoral elections. Note that 1985, 1989, 2005 and 2009 featured incumbent mayors winning reelection en route to long tenures. (Winning handily, in @R_T_Rybak’s cases; I can’t find stats on Donald Fraser’s 1980s wins to say for sure.)
This is turnout by precinct in the 2017 mayoral election.

The R^2 between the percent of a precinct’s voted who ranked Frey anywhere in 2017 and the voter turnout was 0.19.

• • •

Missing some Tweet in this thread? You can try to force a refresh
 

Keep Current with David H. Montgomery

David H. Montgomery Profile picture

Stay in touch and get notified when new unrolls are available from this author!

Read all threads

This Thread may be Removed Anytime!

PDF

Twitter may remove this content at anytime! Save it as PDF for later use!

Try unrolling a thread yourself!

how to unroll video
  1. Follow @ThreadReaderApp to mention us!

  2. From a Twitter thread mention us with a keyword "unroll"
@threadreaderapp unroll

Practice here first or read more on our help page!

More from @dhmontgomery

3 Nov
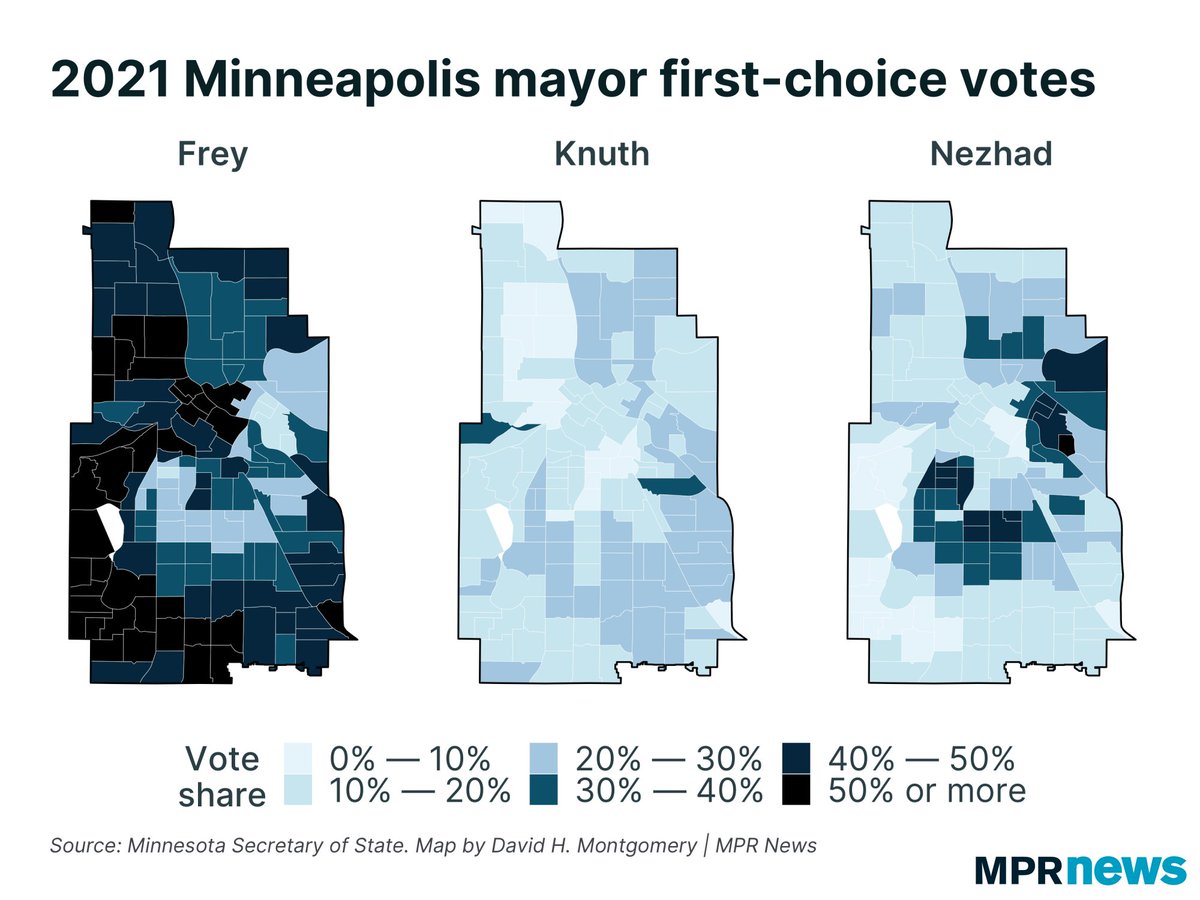
In huge swathes of northern and western Minneapolis, Jacob Frey won outright majorities of the first-choice vote today (though no one topped 65% in any precinct). Sheila Nezhad had her strongholds in Phillips / Powderhorn / University. Knuth did OK almost everywhere.
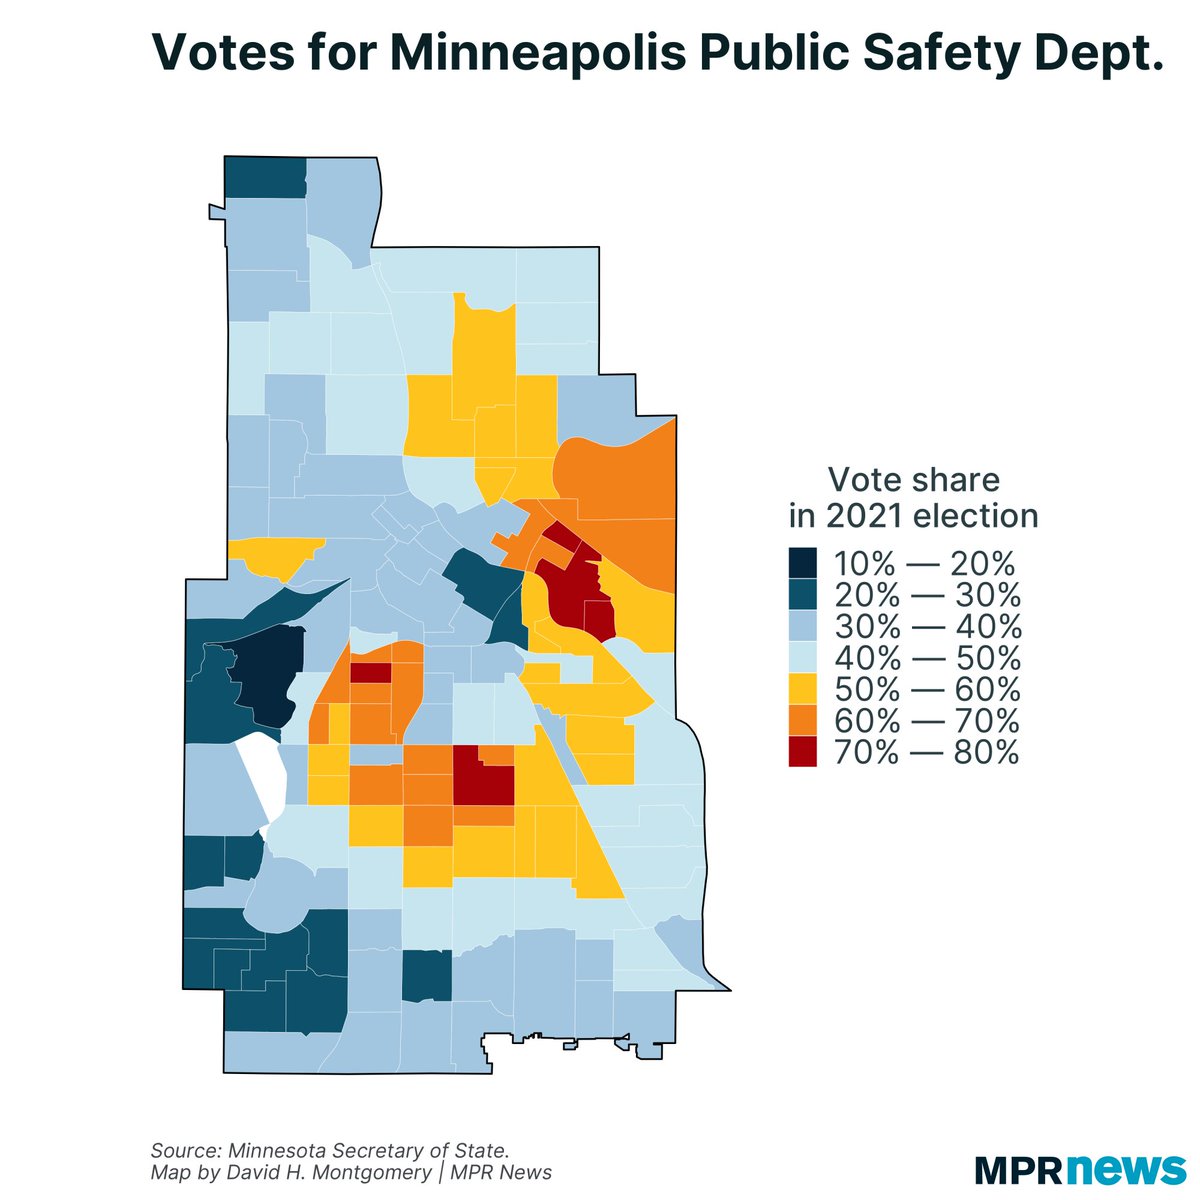
Support for replacing the Minneapolis Police Department with a Department of Public Safety was strong in the same areas Frey did poorly in — Phillips / Powderhorn / University — and weak elsewhere, especially in Southwest Minneapolis.
Votes for Frey and against the Public Safety Department were *highly* correlated at the precinct level.
Read 5 tweets
3 Nov
Alright, let’s try this again, but with correct math.

I’d say Frey might be in trouble if the share of voters ranking in 2nd & 3rd was circa 1-3%. As it is, he’s got a whole lot of votes that will likely come his way as RCV is calculated and candidates eliminated tomorrow.
Frey’s got a whole lot of paths to get to 50%+1 as RCV is calculated. Is it mathematically guaranteed with what we know now? No. There are ways that both Nezhad & Knuth could theoretically win. But I think they’re unlikely.
As I think about it more closely, these old charts weren’t *wrong*. What they were showing is % of *total ballots cast*. My new charts are showing percent of ballots *in each round*. Exhausted ballots change the denominators!
Read 4 tweets
2 Nov
Here’s what I’m looking for when results start coming in tonight, for the RCV mayor’s race. Let me know why I’m dead wrong!

1) Can Frey top 50% in round 1? If he does, it’s over.
2) Is Frey below 40%? If so, really tough path for him.
3) In between, things get interesting…
The general dynamic of the race is Frey vs. the field. Most voters either support the mayor, or oppose him. RCV means anti-Frey voters can scatter their first-choice votes and still come home.
Anti-Frey activists are pushing the “Don’t rank Frey” campaign to minimize the number of voters Frey picks up in later rounds. But plenty of voters probably WILL rank Frey 2nd or 3rd! Not a lot, but certainly not nothing. If Frey’s at 47%+ in the first round, I think he wins easy
Read 8 tweets
2 Nov
I’ll start today’s #COVID19 update with the good news: look at booster shots go!
There’s also an increase in first doses among 12- to 15-year-olds, but it’s pretty small compared to past rates they’ve shown. (About 59% of this group has at least 1 dose.)
So, that’s the good news.

The bad news is everything else. Our latest surge continues, with cases and positivity rates both continuing to rise:
Read 9 tweets
1 Nov
Today @mnhealth is adding data on #COVID19 reinfections for the first time. These have been tracked, but not reported as new cases because each “case” was a person, not an infection.

The upshot: ~8,000 new “cases.”

The true number of actually new cases is 2,857, not 8,184.
@mnhealth These are people who had COVID more than once.

This is distinct from people who had COVID after getting vaccinated, which is a “breakthrough infection,” not a “reinfection.”
@mnhealth Even filtering out all these backdated reinfection cases, the news today isn’t great. Our positivity rate is back over 7%, everything still trending upwards.
Read 8 tweets
29 Oct
Minnesota has closed out an all-around bad week of #COVID19 on a sour note. From Monday through today, our positivity rate rose by 0.7 percentage points, almost erasing last week’s 0.9-point fall. Cases also on the rise.
One week ago, people gave me a bunch of crap for qualifying that week’s decline by saying “the only question is how long it will last.”

I wish I hadn’t been proven right so quickly…
Now, this week’s uptick does not mean cases will continue to RISE indefinitely. It’s entirely possible we’ll get right back to declines next week. The point is, we don’t know the future!
Read 9 tweets

Did Thread Reader help you today?

Support us! We are indie developers!


This site is made by just two indie developers on a laptop doing marketing, support and development! Read more about the story.

Become a Premium Member ($3/month or $30/year) and get exclusive features!

Become Premium

Too expensive? Make a small donation by buying us coffee ($5) or help with server cost ($10)

Donate via Paypal Become our Patreon

Thank you for your support!

Follow Us on Twitter!

:(