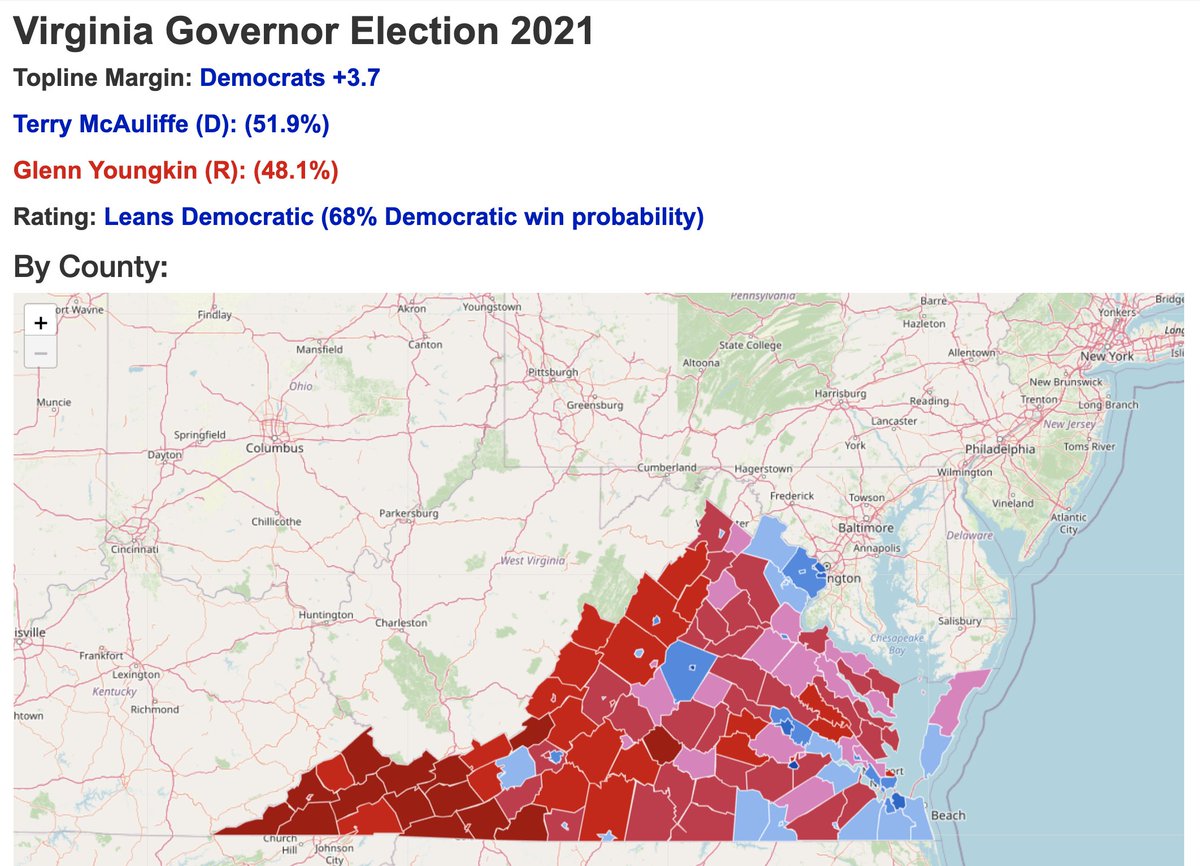
Looks like @Thorongil16 and I will end up on the wrong side of #VAGov predictions.
We took a shot, tried to be transparent about what we did, and ended up giving Youngkin a 33% chance of victory. Those things happen 1/3 of the time. Forecasting and modeling is hard.
Some success for the model: as @Thorongil16 said, we did appear to catch the fact that there would be significantly more college-educated voters in this electorate than in 2020, and modeled the electorate decently well. Where we missed was in margins among demographics.
I don't feel bad for saying polls like Fox were bad. The electorates illustrated by those never materialized. We always said Youngkin's path to victory would consist of flipping a ton of Biden voters, including white suburbanites. And that's what he managed to do.
That said, we ended up actually taking just about all of those polls into our model anyways, so the model missed even while taking them. We really just rejected Emerson (for using MTurk) and some internals (like Trafalgar, and I don't feel bad for rejecting Trafalgar).
This appears to be a case in which Republicans have won by flipping a *lot* of Biden voters across the board. I don't think Democrats lost this race primarily through disaffected voters sitting out -- they lost it b/c lots of Biden voters voted R. That's our biggest model miss.
I did outline exactly what Youngkin needed to do in the threads: persuade a lot of upset Biden voters. We just didn't model him as actually doing it in the median case. But Loudoun's only D+11 (14 pt swing right)!
Looks like he did it -- he's clearing @Thorongil16's benchmarks.
These misses happen, and we weren't the only ones forecasting a D win. Regardless, I hope I (and @Thorongil16) have been kind, respectful, humble, and open in terms of what we've been doing, how these assumptions could break, and what the uncertainty we're dealing with was.
This isn't the last time I'll be wrong, but we knew what we were dealing with and what we were modeling, and we tried to quantify uncertainty. Sometimes the median case doesn't happen, and you can take a shot and miss. We'll learn.
Till next time, then. Thanks for following.
• • •
Missing some Tweet in this thread? You can try to
force a refresh
At the end of a long campaign, here's where the model made by me and @Thorongil16 stands. The race is rated as Lean Democratic, with a forecasted margin of D+3.6 and a win probability of 67%. An interactive map is over at striderforecasts.com.
The consensus on this race is all over the place, and we've seen polls in the last week ranging from D+3 to R+8. Absolutely nobody can agree on what an electorate looks like or who's voting. What we all can agree on is that Democrats have a large early vote (EV) lead...
But even then, nobody knows exactly how big, and the margin here matters. We know via L2 that the EV electorate is roughly 2:1 Biden, but the crossover vote matters here. If it knocks EV down to D+19, Youngkin's probably favored. D+27 and it's likely McAuliffe's race to lose.
On the day before the race, the #VAGov forecast from @Thorongil16 and me remains Lean Democratic, with a D+3.5 margin forecasted and a 67% win probability. An interactive map with county margins is over at striderforecasts.com.
Both have a chance, but I'd rather be McAuliffe.
Youngkin appears to have momentum, and this was a key reason cited by @JMilesColeman and @kkondik in their Lean R call. It's a respectable one you can make a good argument for. I'd disagree primarily for a few reasons...
(1) the overall crosstab splits don't show as many danger signs for Democrats as the toplines do (2) the polling average has been flooded by a host of pro-GOP firms as of late (3) there *appears* to be significant herding and nonresponse impacting the results too
Democrats are still forecasted to win by a touch over 3.5. Race remains Lean Democratic with a 68% win probability, in our eyes.
Some definite late movement in our model to Youngkin, but in our eyes, this is not enough.
Firstly, Virginia is a highly educated Biden +10 state. We begin with a heavier McAuliffe prior due to turnout dynamics that, based on education and propensities, would be more Dem-leaning
I do think some polls have drifted towards heavily R samples; Fox poll yesterday was an example, and based on some of the margins, I think the Echelon poll oversamples Rs. Hard to tell, but I do not think there has been this much movement re: turnout dynamics in the 2 weeks
I can't find crosstabs for this, but on the surface, this is probably not what you want to see if you're Terry McAuliffe. A continuation of the "late movement" theme; whether that's an artifact of LV screens being wonky is unclear, but it goes in the model (D+4.1 now).
pre-emptively to those saying McAuliffe's margin has plunged in our model: in the last 3 days, we've added in the Fox, Washington Post, and Echelon polls. Doesn't take a genius to figure out that it'll change the forecast!
Something in this poll is that enthusiasm is at comparable levels across party lines, so this would indicate Youngkin is pulling a *lot* of Biden voters over to his side. Whether that's a reasonable estimate or not, I don't know, but that's his actual path to victory.
A pretty reasonable poll and electorate screen that tells us more of what we knew: a close race, where more Biden->Youngkin crossover is happening rather than McAuliffe/Trump. Anyways, something interesting is how downballot races like the AG/LG appears to be 3-4 points more Dem.
Youngkin outperforming Trump by 15 or so with noncollege whites would be interesting. I think his path to victory is going to involve some gains with noncollege whites and more gains with college whites, especially if given this level of ticket splitting, but let’s see.
Yeah it’s only a 43% educated electorate but also, if you want to play that game, dragging it up to 50% or so would only give you like a D+3 result at best, so…still a very close race, once again.
Every poll has two parts: the electorate screen and the margins among the demographics. The electorate screen is where you give a representative sample of what you think the electorate will look like. The crosstab margins are the margins among those groups. 🧵
If the electorate screen is broken, there’s a problem. It means that the poll will not be representative of the state. Because fundamentally, you’re giving the results that would occur in an electorate different from the one that actually exists. Allow me to construct an example.
Say that a state is 40% Black, 20% Latino, and 40% White. Your poll would probably want to match up in terms of demographics — You cannot poll all 3M voters in the electorate, so you need a good sample to allow you to approximate what you think the electorate resembles.