van ilango (JustNifty) Profile picture
Nov 4, 2021 β€’ 8 tweets β€’ 4 min read β€’ Read on X
A simple beginning in this long journey.πŸ™

Let us choose the most simplest & most effective of all tools - #Elliottwave
IF the name sounds complex & alien to you, let us call it just #Wave - Why ?
In the market, Prices never flow like a river but unfold like waves.. yes., waves
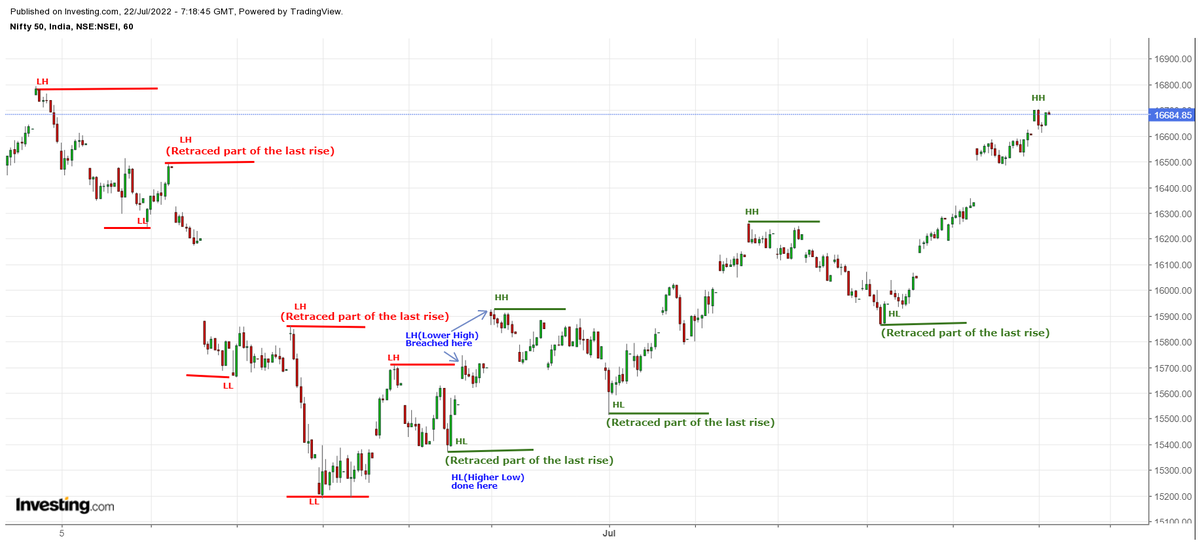
#Waves advance, then retrace and with each advance & retraces, they gather strength & thus the subsequent advances grow in strength & intensity until they blow themselves up. Then, they go into a quiet mode.
This is Nature's Law; Crowd behaviour and we deal with just that.
What this Nature's Law states is that the advances & declines follow "Fibonacci sequences"
1, (1+1)2, (2+1)3, (3+2)5, (5+3)8, (8+5)13, (13+8)21 & so on...
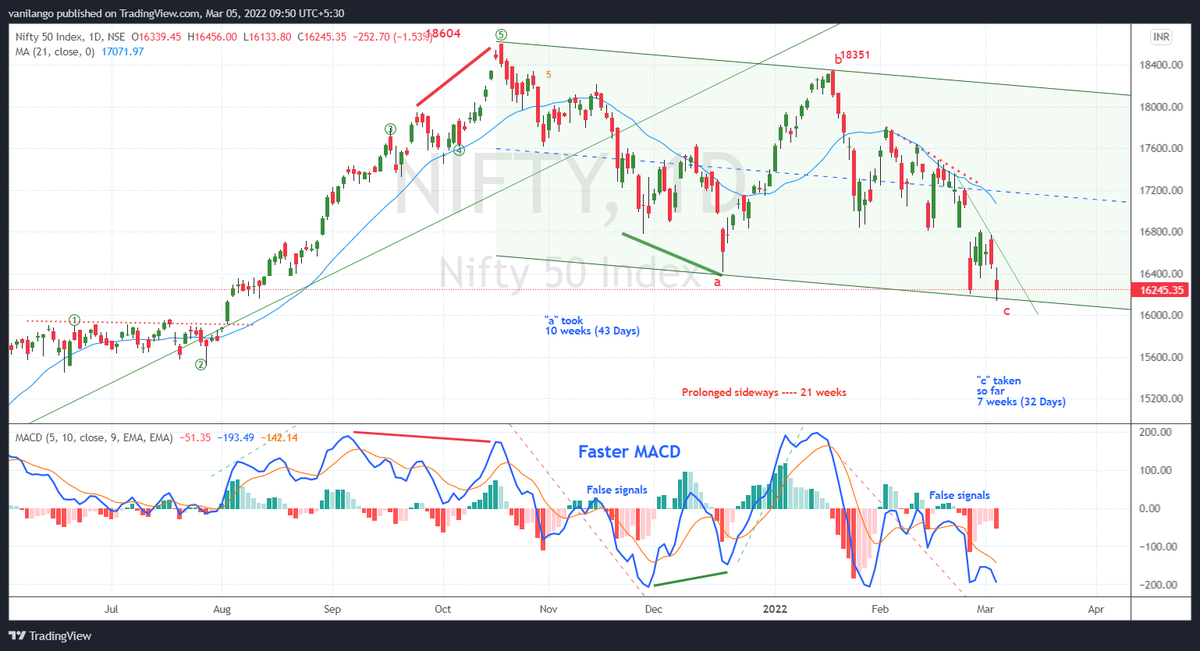
It has been observed by Ralph.N.Elliott (1939) that these advances move in 5 waves followed by a 3 wave decline - 12345 & abc
What is a wave ? No explanation is given by Elliott himself Why? Co's it's highly subjective at the time of labeling each advance & decline. Each perceives it differently
Then, how do we approach it ?
Demand & supply restrict themselves to a channel till one overpowers the other
This, channeling helps to identify each part of wave as 1st, now, 2nd followed by 3rd, etc.,
1st is an advance
2nd is a retrace of 1st by 38%-61.8% or more but never 100%
3rd is the next advance having gathered strength in 1st & pausing in 2nd and thus with great strength
4th is the retrace of 3rd advance by 38% to 61.8% but never touching the 1st top
5th is the last advance, having seen the potential of 3rd & wanting to out beat the 3rd with such force, it generally a vertical rise, highly speculative.
After 5, an "ABC" correction follows retracing 38%-61.8% of entire rise from 1st to 5th.
Generally, this retrace enters the range of 3rd to 4th wave as you can see in #Kotakbank chart

Before we end this beginner step, Know this:
12345 & abc are found all time frames 5 min-month
Take your time to spot waves in stocks and indices.
#Tradingview allows to mark labels easily & you can reject & relabel as new prices reveal more clarity.
Let Mkt correct you
Learn.. Learn.. with simple baby steps & Earn
You have all the TIME but allocation is by YOU & you alone

β€’ β€’ β€’

Missing some Tweet in this thread? You can try to force a refresh
γ€€

Keep Current with van ilango (JustNifty)

van ilango (JustNifty) Profile picture

Stay in touch and get notified when new unrolls are available from this author!

Read all threads

This Thread may be Removed Anytime!

PDF

Twitter may remove this content at anytime! Save it as PDF for later use!

Try unrolling a thread yourself!

how to unroll video
  1. Follow @ThreadReaderApp to mention us!

  2. From a Twitter thread mention us with a keyword "unroll"
@threadreaderapp unroll

Practice here first or read more on our help page!

More from @JustNifty

Jul 22, 2022
#Priceaction
IF trader, then study "Hour chart" of at least 30 trading days
Watch how #prices are #Trending & you take a position when trend changes, say, from making "LH & LL" to "HL & HH" & Vice Versa
This is the 1st & foremost step & absolutely noiseless
#Retracement helpsπŸ™ Image
#Priceaction Step:2
All traders know Demand & Supply to exploit the difference - a basic trait of any trader/ businessman.
What captures this absolutely is #Trendline & #Channel
For Eg: When prices break out of a falling T.Line/ Channel, it means demand has overpowered supply Image
That's first clue-buyers are asserting. LH & LL would soon change.
Next step is to look for a Fibonacci #retracement to hold @ 38% or 50% or 61.8% (to make HL) with a bullish candle like #Bullishengulfing or #Bullishpinbar @ a % of previous rise which is your perfect LRHR entry
Read 9 tweets
Jul 3, 2022
#Nifty
2 Scenarios likely.
In ST, both point towards a min. rise to 50DSma, 16200-250
c = a = 16255
#banknifty
2 Scenarios likely.
In ST, both point towards a min. rise to 50DSma, 34450
c = a = 34915
#Reliance
2 Scenarios likely.
In ST, both point towards a min. rise to 50DSma, 2615

50% - 61.8% #retracement of last fall from 2817 to 2365 @ 2591-2645
Read 5 tweets
Apr 18, 2022
#Nifty
Started last fall fm "17664" on 13th with 1 & 2
Would complete 3rd @ open @ 17220-263, then 4th & 5th.
Last fall #retracement from "17512 - 172xx"
MEma-17175
WLEma-17155
50DSma-17165
Pivot's S3-17195
VF's T6: 17197
IF correction, it must limit to 17220 @ open & then 17165
Based on significant gap down, the "revised trade levels" for the "day" & "Week".
#Nifty @ 17108-137 of VF's trade table's key level with a low of "17130"
Read 4 tweets
Mar 11, 2022
#Nifty
Index & most stocks done 3rd & 4th wave yesterday.
Holding approx. yesterday's low, "5th" wave to unfold today in opening session towards "16796-816".

Alt: Consolidation in most part of the day in yesterday's range.
#Nifty Trade plan:

1. keeping above β€œ16465-485β€³ - "Low @ 16471" ---

---prices likely to head towards 16685-715 & above which 16910-925.
#Nifty
Pre-Market Observations:
1. "5th" wave unfolds holding yesterday's low 16448
2. A Broad trading range within yesterday's High & Low

Trade plan Buy @ 16465-485
1st Resistance : 16685-715

From 16471, high done 16673 so far.

Now, Holding "16545-575", up move continues..
Read 4 tweets
Mar 5, 2022
Macd is the simplest & most reliable indicators available. Macd uses Moving Averages & turn them into momentum indicator by subtracting longer MA from shorter MA. The subtracted value when plotted forms a line that oscillates above & below zero, without any upper/ lower limits. Image
Using shorter Moving Average (5 & 10) will produce a quicker, more responsive indicator (fast macd), while using longer MA (12 & 26) will produce a slower indicator (Slow macd), less prone to whipsaws.

Macd measures the difference between two Exponential Moving Averages (EMAs). Image
A +ve Macd indicates that 5 or 12-day Ema is trading above 10 or 26-day Ema. A -ve Macd indicates that 5 or 12-day Ema is trading below 10 or 26-day Ema. If Macd is -ve & declining, then -ve gap between faster MA & slower MA is expanding & Downward momentum is accelerating.. Image
Read 7 tweets
Dec 3, 2021
#Nifty
There are 2 Key retraces to follow for the Day.
1st is fm 17281 - 17420 @ 17330-350 (Aggressive)
2nd is fm 17064 - 17420 @ 17240-285(Conservative)

Based on Pivot tables,
17310-335 is a key support zone,
17470-500 is a key resistance zone.
#Nifty
There are 2 Key retraces to follow for the Day.
1st is fm 17281 - 17420 @ 17330-350 (Aggressive)
2nd is fm 17064 - 17420 @ 17240-285(Conservative)

Based on Pivot tables,
17310-335 is a key support zone,
17470-500 is a key resistance zone.
#Nifty
Based on Pivot tables,
17310-335 is a key support zone,
17470-500 is a key resistance zone.

Didn't get the "BUY" trade
BUT, a "Sell" trade emerged @ "17470-500" with a high of 17490 with OB readings and generated
100+ points with a low of "17362"
Read 6 tweets

Did Thread Reader help you today?

Support us! We are indie developers!


This site is made by just two indie developers on a laptop doing marketing, support and development! Read more about the story.

Become a Premium Member ($3/month or $30/year) and get exclusive features!

Become Premium

Don't want to be a Premium member but still want to support us?

Make a small donation by buying us coffee ($5) or help with server cost ($10)

Donate via Paypal

Or Donate anonymously using crypto!

Ethereum

0xfe58350B80634f60Fa6Dc149a72b4DFbc17D341E copy

Bitcoin

3ATGMxNzCUFzxpMCHL5sWSt4DVtS8UqXpi copy

Thank you for your support!

Follow Us!

:(