Allen Au ๐Ÿงข Profile picture
Nov 4, 2021 โ€ข 19 tweets โ€ข 10 min read โ€ข Read on X
๐—–๐—ง๐—  #๐—•๐—ง๐—– ๐—ข๐—ป-๐—–๐—ต๐—ฎ๐—ถ๐—ป ๐— ๐—ฒ๐˜๐—ฟ๐—ถ๐—ฐ ๐——๐—ฎ๐˜€๐—ต๐—ฏ๐—ผ๐—ฎ๐—ฟ๐—ฑ: ๐—ช๐—ฒ๐—ฒ๐—ธ ๐Ÿฐ๐Ÿฏ '๐Ÿฎ๐Ÿญ

๐—ฃ๐—ฒ๐—ฎ๐—ธ ๐—œ๐—ป๐—ฑ๐—ถ๐—ฐ๐—ฎ๐˜๐—ผ๐—ฟ๐˜€

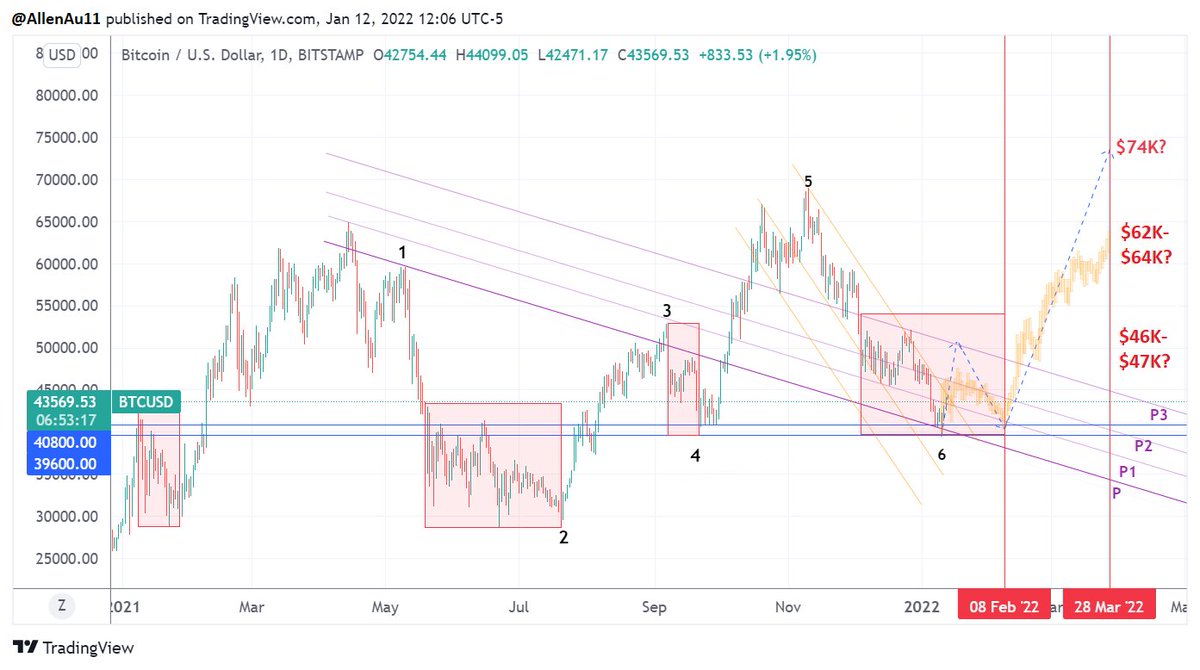
TLDR: BTC's cycle peak is projected to be in Dec 2021 amidst the Fed's tapering.

BTC is en route to its cycle peak & its price may break out sharply higher soon.
The missing #BTC on-chain peak indicators๐Ÿงต๐Ÿ‘‡

๐Ÿญ๐—ฎ. ๐—ง๐—ผ๐—ฝ ๐—–๐—ฎ๐—ฝ ๐— ๐—ผ๐—ฑ๐—ฒ๐—น
This model is based on Willy Woo's Top Cap Model for tracking BTC's cycle peak. The bear phase bottom tracker is based on BTC's moving average price.

BTC hasn't peaked yet.
๐Ÿญ๐—ฏ. ๐—™๐—ถ๐—ฏ ๐— ๐˜‚๐—น๐˜๐—ถ๐—ฝ๐—น๐—ถ๐—ฒ๐—ฟ๐˜€
This model is based on Fib retracement & extension numbers as multiples of the 350D SMA of #BTC's price.

BTC hasn't peaked yet.
๐Ÿญ๐—ฏ. ๐—™๐—ถ๐—ฏ ๐— ๐˜‚๐—น๐˜๐—ถ๐—ฝ๐—น๐—ถ๐—ฒ๐—ฟ๐˜€ ๐— ๐—ผ๐—ฑ๐—ฒ๐—น
This model is based on Fib retracement & extension numbers as multiples of the 350D SMA of #BTC's price.

BTC hasn't peaked yet.
๐Ÿญ๐—ฏ. ๐—™๐—ถ๐—ฏ ๐— ๐˜‚๐—น๐˜๐—ถ๐—ฝ๐—น๐—ถ๐—ฒ๐—ฟ๐˜€ ๐— ๐—ผ๐—ฑ๐—ฒ๐—น
This model is based on Fib retracement & extension numbers as multiples of the 350D SMA of #BTC's price.

BTC hasn't peaked yet.
๐Ÿฎ. ๐Ÿฒ๐Ÿฌ-๐——๐—ฎ๐˜† ๐—ฉ๐—ผ๐—น๐—ฎ๐˜๐—ถ๐—น๐—ถ๐˜๐˜†

#BTC to peak: 24-29 Dec. 2021

In the past, BTC would peak before the Fed began tapering. Though the Fed begins tapering soon, BTC may not peak this month as the Fed will adjust the tapering pace- loose tightening!

๐Ÿฏ. ๐—จ๐—ฆ ๐—œ๐—ป๐˜€๐˜๐—ถ๐˜๐˜‚๐˜๐—ถ๐—ผ๐—ป๐—ฎ๐—น #๐—•๐—ง๐—– ๐—ฃ๐˜‚๐—ฟ๐—ฐ๐—ต๐—ฎ๐˜€๐—ฒ ๐—ฃ๐—ฎ๐˜๐˜๐—ฒ๐—ฟ๐—ป (>๐Ÿฌ.๐Ÿฌ๐Ÿฌ๐Ÿฑ๐Ÿฏ)
๐—ก๐—ผ, but this metric is wicking up!

* Please read 2(ii)(e) of pinned tweet for details about this metric to determine BTC topping pattern & whether cycle peak is imminent.
4(i) ๐— ๐—ฉ๐—ฅ๐—ฉ-๐—ญ ๐—ฆ๐—ฐ๐—ผ๐—ฟ๐—ฒ (>๐Ÿณ.๐Ÿฑ): ๐—ก๐—ผ

10/31: 2.4*

* The chart pattern of this metric is similar to that in 2013 & looks to be on the verge of breaking out along with #BTC's price.
4(ii) ๐— ๐—ฉ๐—ฅ๐—ฉ-๐—ญ ๐—ฆ๐—ฐ๐—ผ๐—ฟ๐—ฒ (๐Ÿฏ๐Ÿฌ-๐——๐—ฎ๐˜† ๐— ๐—”) (๐—ช๐—ฎ๐˜ƒ๐—ฒ ๐Ÿฑ): ๐—ฌ๐—ฒ๐˜€

#BTC is on its way to its cycle peak.
5. ๐Ÿญ-๐—ฌ๐—ฟ+ ๐—›๐—ข๐—Ÿ๐—— ๐—ช๐—ฎ๐˜ƒ๐—ฒ (~๐Ÿฐ๐Ÿณ%): ๐—ก๐—ผ

10/31: 54%
6(i) ๐—ฅ๐—ฒ๐˜€๐—ฒ๐—ฟ๐˜ƒ๐—ฒ ๐—ฅ๐—ถ๐˜€๐—ธ (>๐Ÿฌ.๐Ÿฌ๐Ÿฎ): ๐—ก๐—ผ

10/31: 0.004*

The Reserve Risk chart pattern is similar to that in 2013. If history rhymes, #BTC's price will move up sharply soon.
6(ii) ๐—ฅ๐—ฒ๐˜€๐—ฒ๐—ฟ๐˜ƒ๐—ฒ ๐—ฅ๐—ถ๐˜€๐—ธ (๐Ÿฏ๐Ÿฌ-๐——๐—ฎ๐˜† ๐— ๐—”) (๐—ช๐—ฎ๐˜ƒ๐—ฒ ๐Ÿฑ): ๐—ฌ๐—ฒ๐˜€

#BTC is on its way to its cycle peak.
6(ii) ๐—ฅ๐—ฒ๐˜€๐—ฒ๐—ฟ๐˜ƒ๐—ฒ ๐—ฅ๐—ถ๐˜€๐—ธ (๐Ÿฏ๐Ÿฌ-๐——๐—ฎ๐˜† ๐— ๐—”) (๐—ช๐—ฎ๐˜ƒ๐—ฒ ๐Ÿฑ): ๐—ฌ๐—ฒ๐˜€

#Bitcoin is on its way to its cycle peak.
7. ๐—ฅ๐—ฒ๐—ฎ๐—น๐—ถ๐˜‡๐—ฒ๐—ฑ ๐—›๐—ข๐——๐—Ÿ ๐—ฅ๐—ฎ๐˜๐—ถ๐—ผ (๐—ฅ๐—›๐—ฅ) (>๐Ÿฐ๐Ÿฌ๐—ž): ๐—ก๐—ผ

10/31: 12392*

* RHR is similar to that when #BTC was on #CTM Wave 2 of the 2013 & 2017 bull phases.

The RHR chart pattern looks similar to that in 2013. If history rhymes, BTC's price could move up sharply.
๐Ÿด. ๐—ฅ๐—ฒ๐—ฎ๐—น๐—ถ๐˜‡๐—ฒ๐—ฑ ๐—–๐—ฎ๐—ฝ ๐—›๐—ข๐——๐—Ÿ ๐—ช๐—ฎ๐˜ƒ๐—ฒ๐˜€ (๐Ÿฏ๐—ฟ๐—ฑ ๐—ช๐—ฎ๐˜ƒ๐—ฒ):
๐—ช๐—ฎ๐˜ƒ๐—ฒ ๐Ÿญ

* It looks like RC HODL Waves has entered Wave 2 of the 3-Wave pattern & this will be accompanied by the next leg up in #BTC's bull phase.
9(i) ๐—ฃ๐˜‚๐—ฒ๐—น๐—น ๐— ๐˜‚๐˜๐—ถ๐—ฝ๐—น๐—ฒ (>๐Ÿฐ): ๐—ก๐—ผ

10/31: 1.41
9(i) ๐—ฃ๐˜‚๐—ฒ๐—น๐—น ๐— ๐˜‚๐˜๐—ถ๐—ฝ๐—น๐—ฒ (>๐Ÿฐ): ๐—ก๐—ผ

10/31: 1.41
9(ii) ๐—ฃ๐˜‚๐—ฒ๐—น๐—น ๐— ๐˜‚๐—น๐˜๐—ถ๐—ฝ๐—น๐—ฒ (๐Ÿฏ๐Ÿฌ-๐——๐—ฎ๐˜† ๐— ๐—”) (๐—ช๐—ฎ๐˜ƒ๐—ฒ ๐Ÿฑ): ๐—ฌ๐—ฒ๐˜€

#Bitcoin is on its way to its cycle peak.
10. ๐—ก๐—จ๐—ฃ๐—Ÿ (๐—•๐—น๐˜‚๐—ฒ): ๐—ก๐—ผ ๐—˜๐˜‚๐—ฝ๐—ต๐—ผ๐—ฟ๐—ถ๐—ฎ

10/31: 0.62 (Green)*

* This is similar to that when #BTC was on #CTM Wave 2 of the 2013 & 2017 bull phases.

The NUPL chart looks similar to that in 2013 (circled in blue). If history rhymes, BTC's price may move up sharply soon.

โ€ข โ€ข โ€ข

Missing some Tweet in this thread? You can try to force a refresh
ใ€€

Keep Current with Allen Au ๐Ÿงข

Allen Au ๐Ÿงข Profile picture

Stay in touch and get notified when new unrolls are available from this author!

Read all threads

This Thread may be Removed Anytime!

PDF

Twitter may remove this content at anytime! Save it as PDF for later use!

Try unrolling a thread yourself!

how to unroll video
  1. Follow @ThreadReaderApp to mention us!

  2. From a Twitter thread mention us with a keyword "unroll"
@threadreaderapp unroll

Practice here first or read more on our help page!

More from @AllenAu11

Jan 18, 2022
When will #BTC's correction be over? How low could its price get?

1. Bull market isn't over as fundamentals are strong
2. BTC is in another mid-cycle correction
3. If $40K-$41K support is breached, BTC could fall to $29K-$37K by end of Jan. 2022, but would quickly rebound >$40K Image
1. #BTC's fundamentals as reflected by key on-chain data are strong. Hash rate has reached a new ATH. LT HODLers continue to hold onto their BTC despite BTC's recent correction. Supply dynamics favor a continuation of the bull run rather than BTC diving into a bear phase.
2. BTC's price continues to track its move from Jan. 21- Jul. 21. (areas marked in pink boxes), but could be 5 days shorter in duration.

The current correction is similar to that of last summer & thus could be over at the end of Jan. 2022.
Read 8 tweets
Jan 15, 2022
#Bitcoin Cycle Peak Dash Board

TLDR:
1. The Dash Board is revamped with the update of the BLX & Top Cap models & the intro. of LGC model

2. 4 models to better gauge peak timing

3. Projected Cycle Peak

Timing: 2nd-3rd Qtr. 2022
Price: $100K-$200K
Hopium Price: $320K Image
1a/ The #BTC Cycle Peak Dash Board is revamped with the update of the Top Cap & BLX Models.


1b/ The #BTC LGC (Logarithmic Growth Curves) model is introduced to gauge cycle peak timing & cycle peak price taking into account the growth pattern of BTC.

Read 12 tweets
Jan 12, 2022
#BTC is finally rebounding, but how high could its price get?

TLDR:
If impulse move plays out:
High: $74K
Middle: $62-$64K
Low: $46K-$51K
Timing: Mid-Jan. to End of Mar. 2022

If move fails, BTC could test $32K-$37K
Timing: Mid-Jan to Mid-Feb. 2022
1a/ Parallel channel breakout

If #BTC breaks out from its downward sloping parallel channel, it could have a price increase of $17.2K from the point of breakout. If there is a confirmed break of the upper channel (~$44.5K), the target price is ~$62K.

Strong resistance at $46K.
1b/ If #BTC fails to break out of the channel, it'd retest the $40K-$41K resistance again before resuming up. Breaching that, it'd fall between $32K & $37K.

As the bull phase is still intact, it shouldn't fall below (Wave 2= $29.2K*).

* Not Elliott Wave count
Read 6 tweets
Jan 10, 2022
The following #BTC peak model with time-based Fib is inspired by @TechDev_52 who combines BTC log growth curves with Fib levels on a 2-week BTC chart.

TLDR:
BTC Cycle Peak
Price:
- High: $180K
- Middle: $120K
- Low: $96K
Time: 2nd Qtr. '22

2.618 Fib: $370K (1st Qtr. '24)? Image
1a/This model (LGC) is constructed on Tradingview with #BTC log growth curves developed by @quantadelic with log Fib levels & time-based Fib zones added on a 2-week BTC chart. This is similar to TechDevโ€™s chart, but the cycle peak log Fib level is at 2.618 & not 2.272.
2a/ To derive the timing of the cycle peak, time-based Fib zones are drawn from mid-cycle correction to the peak of the impulse move after that correction at or above the 1.618 log Fib level.

In past cycles, the peak occurred right between time-based 1.618 Fib & 2 Fib zones.
Read 8 tweets
Jan 6, 2022
Some people are calling a giant head & should pattern for #BTC with a target price of $10K-$18K. Possible, but highly unlikely! Why?

TLDR:
1. US10Y: Bullish
2. BTC Futures: Bullish
3. BTC Options Bullish
4. Technicals: BTC could grind down to $40K-$41K & then rebound to $64K
1a/ #BTC's price has been highly correlated with US10Y & they had moved in lock-steps since 11/8/21 until last week. Traders risked off ahead of the Fed minutes & sold stocks & BTC.
1b/ The Fed will probably quicken the pace of tapering & raise rates sooner, but will likely allow their treasuries holdings to mature (no quantitative tightening or shrinking of B/S).

As long as the US economy is growing, a modest rate hike won't crash the markets.
Read 10 tweets
Jan 5, 2022
UPDATE: BLX Cycle Peak Model

#BTC again closed below the arc of the BLX model on 12/31/21 so that invalidated 1/9/22 & $350K peak predictions.

Started afresh, fixed model & found 2 numbers: 608 & 2191.

TLDR:
1. Cycle Peak Price
- $325K (Best case)
- $95K-$155K (Base case)
๐Ÿ‘‡
TLDR (Cont...)

2. Projected Peak Timing: Early 2nd Qtr. 2022
3. Model points to lengthening of cycle
4. Projected next cycle peak in late 3rd Qtr. 2026 when hyperbitcoinization may occur
1/ The fact that #BTC prices closed below the arc of the original BLX model in 2 consecutive months means that something is wrong either in the model or bull phase is over.

I don't think the cycle peak is in so I started anew. I used parallel channels to reconstruct the model.
Read 17 tweets

Did Thread Reader help you today?

Support us! We are indie developers!


This site is made by just two indie developers on a laptop doing marketing, support and development! Read more about the story.

Become a Premium Member ($3/month or $30/year) and get exclusive features!

Become Premium

Don't want to be a Premium member but still want to support us?

Make a small donation by buying us coffee ($5) or help with server cost ($10)

Donate via Paypal

Or Donate anonymously using crypto!

Ethereum

0xfe58350B80634f60Fa6Dc149a72b4DFbc17D341E copy

Bitcoin

3ATGMxNzCUFzxpMCHL5sWSt4DVtS8UqXpi copy

Thank you for your support!

Follow Us!

:(