#MACD is a common indicator which most of us use in the stock market.
This learning thread would be on
"𝙐𝙨𝙚𝙨 𝙤𝙛 𝑴𝑨𝑪𝑫"
Like👍 & Retweet🔁for wider reach and for more such learning thread in the future.
Also, a trading strategy is shared in the end.
1/16
This learning thread would be on
"𝙐𝙨𝙚𝙨 𝙤𝙛 𝑴𝑨𝑪𝑫"
Like👍 & Retweet🔁for wider reach and for more such learning thread in the future.
Also, a trading strategy is shared in the end.
1/16
Before going ahead, those who want to understand what MACD indicator is and what was its history?
They can read about this in the link below👇
investopedia.com/terms/m/macd.a…
An image of how MACD indicator looks like is shared.
2/16
They can read about this in the link below👇
investopedia.com/terms/m/macd.a…
An image of how MACD indicator looks like is shared.
2/16
Strategy 1:
MACD Crossover.
It's like the Moving Average Crossover.
Bullish Setup:
1. Blue Line crosses above Orange Line.
2. Or Green bars are formed after Red bars.
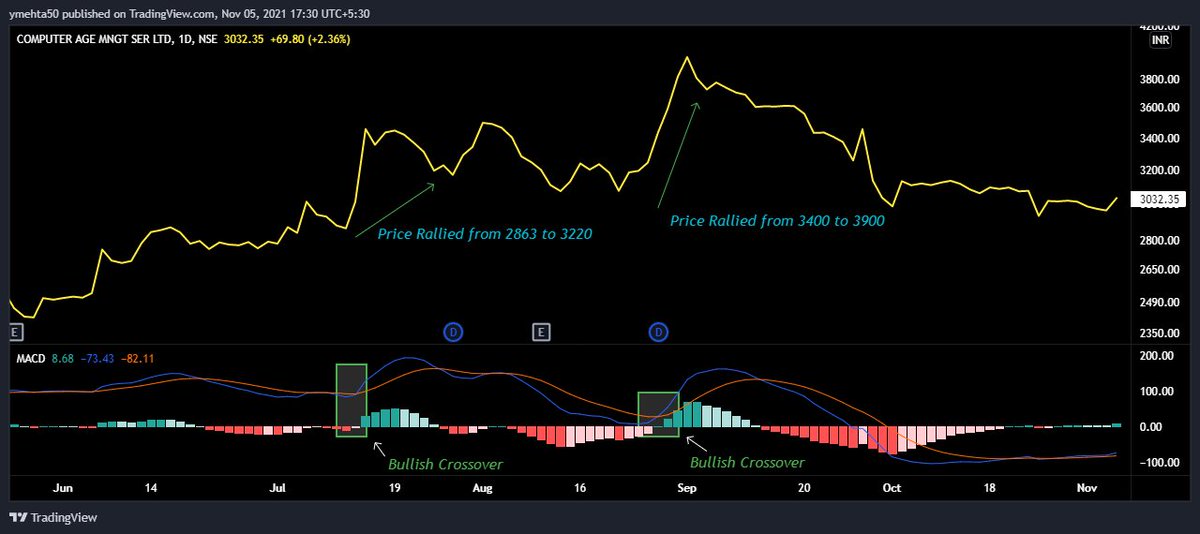
CAMS chart is shared for bullish crossover.
Line chart is used only for demonstration.
3/16
MACD Crossover.
It's like the Moving Average Crossover.
Bullish Setup:
1. Blue Line crosses above Orange Line.
2. Or Green bars are formed after Red bars.
CAMS chart is shared for bullish crossover.
Line chart is used only for demonstration.
3/16
Bearish Setup:
1. Orange Line crosses above Blue Line.
2. Or Red bars are formed after Green bars.
CAMS chart is shared for bearish crossover.
Again this setup will look basic and easy but in real trading it is not that easy.
4/16
1. Orange Line crosses above Blue Line.
2. Or Red bars are formed after Green bars.
CAMS chart is shared for bearish crossover.
Again this setup will look basic and easy but in real trading it is not that easy.
4/16

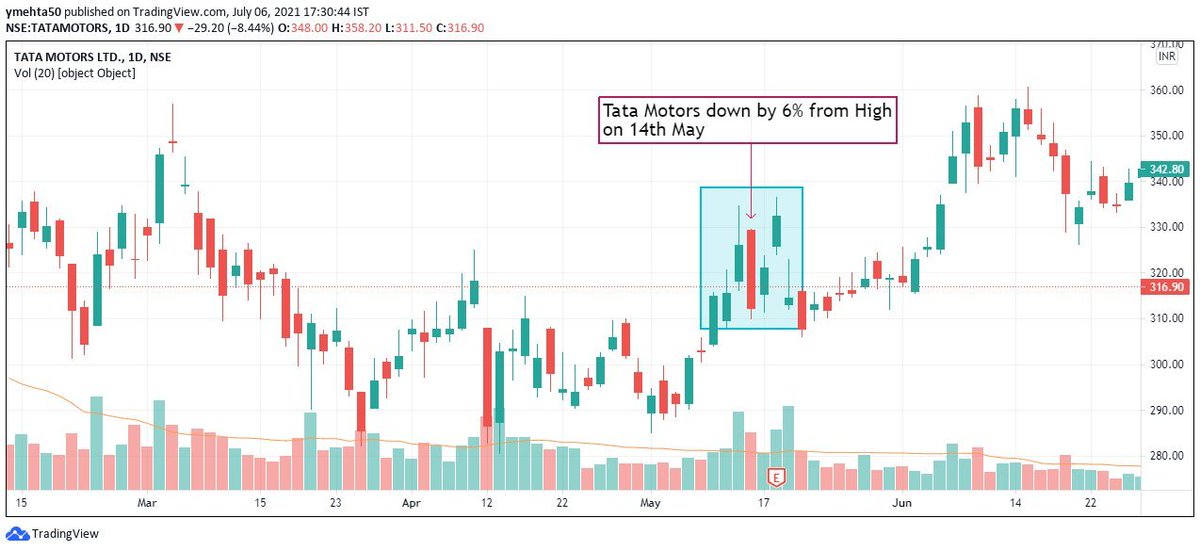
There can be a lot of crossovers in case of consolidation or noise which can result in frequent entry and exit in the stock.
This can add up in transaction cost and minor losses as well.
CDSL chart is shared which had 6 crossovers in 3 months.
5/16
This can add up in transaction cost and minor losses as well.
CDSL chart is shared which had 6 crossovers in 3 months.
5/16

It is not recommended to use MACD as a single indicator. It can be used as a supporting indicator for confirmation.
One can add some more additional rules in MACD like:
Buy a stock if MACD crosses above 0 and sell/exit a stock if MACD crosses below 0.
6/16
One can add some more additional rules in MACD like:
Buy a stock if MACD crosses above 0 and sell/exit a stock if MACD crosses below 0.
6/16
MACD can be used in any time frame (1 minutes to Monthly time frame). Lesser the time frame there would be more noise.
If one uses higher time frame like Monthly or Weekly chart, then one would get less noise and a smooth move in price.
7/16
If one uses higher time frame like Monthly or Weekly chart, then one would get less noise and a smooth move in price.
7/16
Another Setup is Divergence, and it is similar to the RSI Divergence that we have studied.
There are same two types of common Divergence:
1. Bullish Divergence
2. Bearish Divergence
Divergence is used by the traders who like to take contra trade.
8/16
https://twitter.com/YMehta_/status/1451526041705476098
There are same two types of common Divergence:
1. Bullish Divergence
2. Bearish Divergence
Divergence is used by the traders who like to take contra trade.
8/16
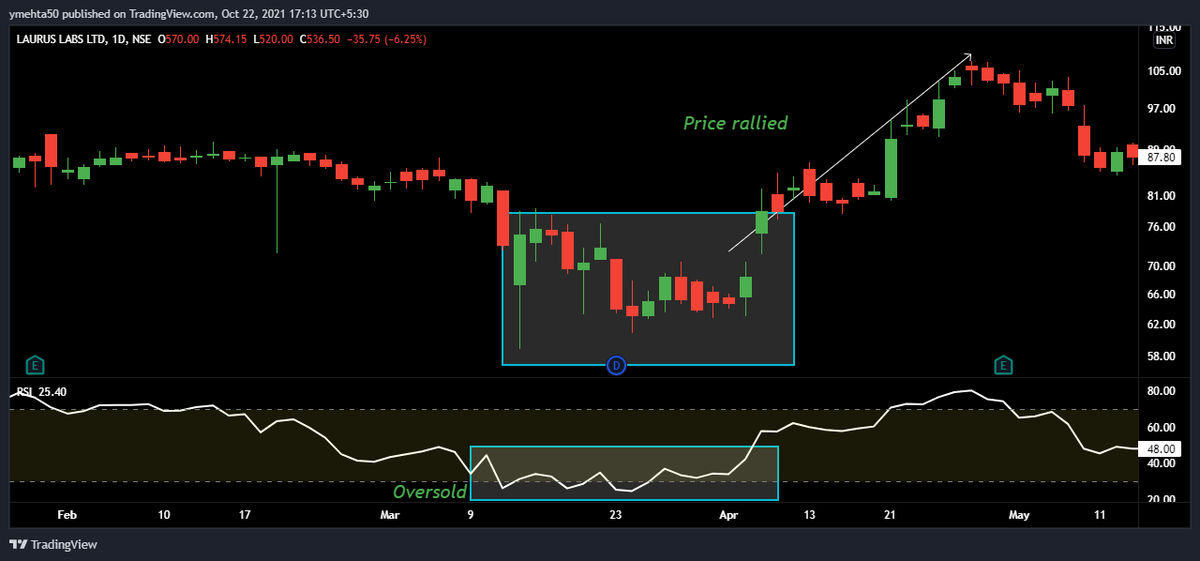
Bullish Divergence:
Condition-
1. Price should form lower lows
2. MACD Bullish Crossover should form higher lows and it should be below 0 level.
CDSL weekly chart is shared which has less noise.
After bullish divergence, price moved up from 260 to 550 (110% returns).
9/16
Condition-
1. Price should form lower lows
2. MACD Bullish Crossover should form higher lows and it should be below 0 level.
CDSL weekly chart is shared which has less noise.
After bullish divergence, price moved up from 260 to 550 (110% returns).
9/16

Bearish Divergence:
Condition-
1. Price should form higher highs
2. MACD Bearish Crossover should form lower highs and it should be above 0 level.
As seen in Reliance Chart.
Bearish Divergence was formed and price corrected from 2300 to 1900 (17% down).
10/16
Condition-
1. Price should form higher highs
2. MACD Bearish Crossover should form lower highs and it should be above 0 level.
As seen in Reliance Chart.
Bearish Divergence was formed and price corrected from 2300 to 1900 (17% down).
10/16

Now sharing a last setup which I use sometime for short-term trading.
Following things is used:
1. Heiken Ashi Candle (Reduces Noise from chart)
2. MACD Indicator
Those who want to understand about Heiken Ashi Candles can go through this link👇
investopedia.com/trading/heikin…
11/16
Following things is used:
1. Heiken Ashi Candle (Reduces Noise from chart)
2. MACD Indicator
Those who want to understand about Heiken Ashi Candles can go through this link👇
investopedia.com/trading/heikin…
11/16
Buying Setup:
1. Price should be in Downtrend.
2. Three Consecutive Bullish Heiken Ashi Candle should be formed.
3. MACD bullish Crosssover and that too below 0 line.
4. Bullish Divergence is a bonus (This is optional)
All condition must satisfy in buying setup.
12/16
1. Price should be in Downtrend.
2. Three Consecutive Bullish Heiken Ashi Candle should be formed.
3. MACD bullish Crosssover and that too below 0 line.
4. Bullish Divergence is a bonus (This is optional)
All condition must satisfy in buying setup.
12/16
Exit Setup:
1. MACD Bearish Crossover happens above 0 line or if MACD goes below 0 line.
2. Three consecutive Bearish Heiken Ashi Candles
One can customise exit setup as:
1. If all condition satisfy then exit or If anyone condition satisfies then exit
13/16
1. MACD Bearish Crossover happens above 0 line or if MACD goes below 0 line.
2. Three consecutive Bearish Heiken Ashi Candles
One can customise exit setup as:
1. If all condition satisfy then exit or If anyone condition satisfies then exit
13/16
Let's see some examples or case studies.
Neuland Lab chart on weekly time frame.
All the condition of buying setup got satisfied and price move from 400 to 1060.
At 1060, condition of exit setup got satisfied and hence exited.
Returns of 165% in the short term.
14/16
Neuland Lab chart on weekly time frame.
All the condition of buying setup got satisfied and price move from 400 to 1060.
At 1060, condition of exit setup got satisfied and hence exited.
Returns of 165% in the short term.
14/16

Same setup for short-term trading can be used in Daily or Monthly Time Frame as well.
Avoid using it Intraday setup as it will give whipsaws because of noise.
This is not a holy grail strategy so follow exit strategy.
Book loss immediately if exit strategy is satisfied.
15/16
Avoid using it Intraday setup as it will give whipsaws because of noise.
This is not a holy grail strategy so follow exit strategy.
Book loss immediately if exit strategy is satisfied.
15/16
I hope everyone got an essence of how MACD can be used.
These are not a universal rules one must follow. One can create their rule, tweak it or follow someone else rules.
Only important thing is one must follow a fix rule instead of tweaking or changing setup frequently.
16/16
These are not a universal rules one must follow. One can create their rule, tweak it or follow someone else rules.
Only important thing is one must follow a fix rule instead of tweaking or changing setup frequently.
16/16
• • •
Missing some Tweet in this thread? You can try to
force a refresh