What would a persistently looser-than-neutral Fed policy mean for equities? With the exception of the 1970s, equities are an effective inflation hedge and should do OK. What about the big growers though? Take a look at this chart, and I'll explain. (THREAD)
As the chart above shows (h/t to Kevin Muir of The Macro Tourist), the relative performance of large growth to small value has a clear inverse correlation to long-term interest rates. /2
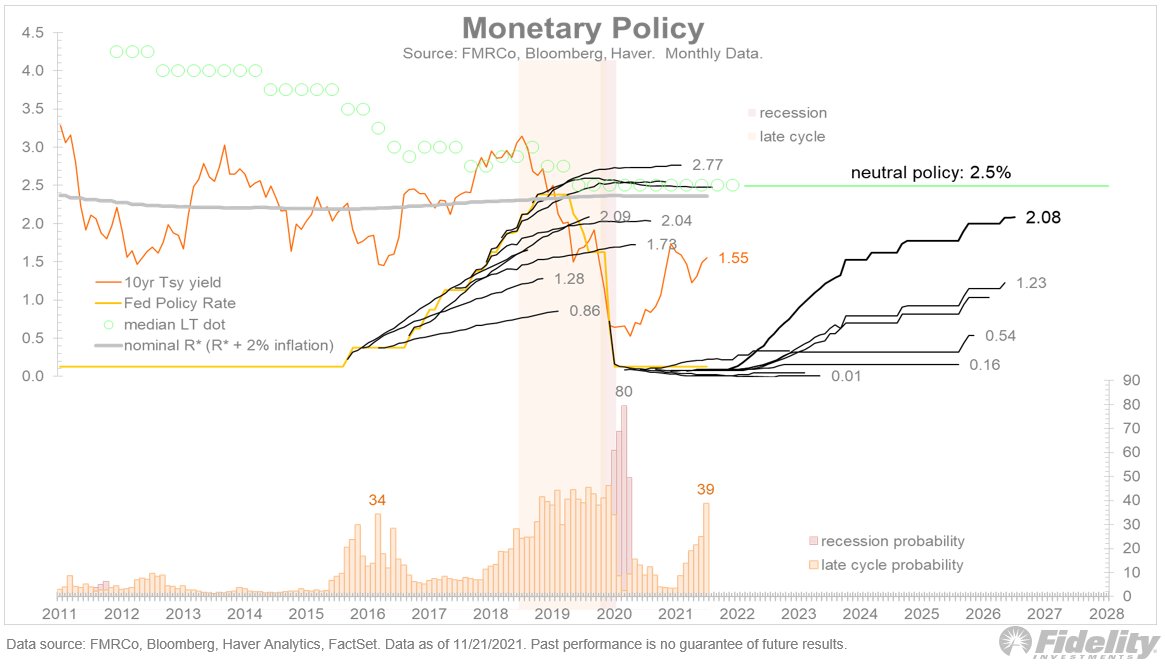
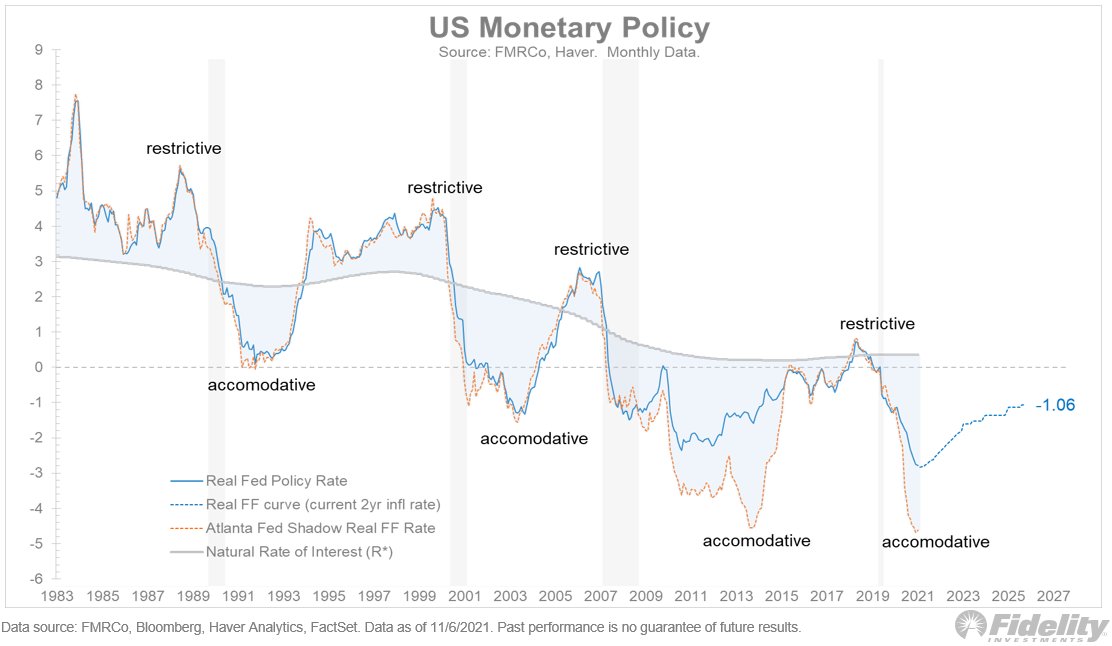
If you believe that the rates market is underestimating the degree of Fed tightening in the coming years (and that long rates will rise accordingly), then you should probably not own too many long duration large-cap growth stocks. /3
But if rates stay relatively low—at least compared to inflation—even the big growers (which have been leading the charge as of late) could hang in there. /END
• • •
Missing some Tweet in this thread? You can try to
force a refresh
The Fed is likely keeping an eye on financial conditions, as it did during the last cycle. They are a real-time look into the financial economy, which is more forward looking than the lagging indicators of the real economy (inflation & employment). (THREAD)
Here we see financial conditions for this cycle and the previous four periods of tightening financial conditions (measured from the low point in the Goldman Sachs Financial Conditions Index). /2
So far, financial conditions remain very loose, but the USD is up and credit spreads are slightly wider. /3
In some ways, the current Fed cycle reminds me of 2015-18. Take a look at this chart and I'll explain. (THREAD)
Back in late 2015, the Fed finally hiked rates for the first time. Back then there was a massive policy divergence between the US (which was normalizing) and the rest of the world (mainly Europe and China, which were spiraling down). /2
Just a few weeks after achieving lift-off, energy spreads blew out and the dollar soared, causing financial conditions to seize up. The Fed backed off, and this enabled the economy to ease back into mid-cycle. It was the great cycle extender. /3
How late are we in the current business cycle? The market and the Fed seem to have different opinions on that. (THREAD)
As the chart above shows, the market is on board with the Fed regarding its rate trajectory in 2022 and 2023, but is underpricing the Fed’s intended return all the way back to neutral (R-Star) in the out years. /2
The dot plot is at 2.5% as the terminal point and the market is at 2%. It’s not a huge difference, but it’s a difference. /3
If the inflation surge persists, it could cause a further reset for nominal rates, which remain well below where they should be based on their correlation to inflation expectations. But the Fed’s gigantic balance sheet plays a role in keeping rates below normal. (THREAD)
If there is an inflation scare, the Fed could be forced to overshoot the neutral rate (R*) by tightening faster/harder, and in the process forcing rates to rise beyond what the economy can withstand. That would be your classic late-cycle policy error (three steps & a stumble). /2
The alternative scenario is that the Fed understands that today’s over-indebted economy is highly levered to low rates, and that it will just have to accept higher structural inflation and keep policy on the looser side of neutral. /3
The Fed’s taper starts this month & should be a wrap by mid 2022. The rates market has experienced quite the whipsaw, at first pricing in more rate hikes sooner, then un-pricing some of them. As of Friday, the market expects the Fed funds rate to end 2022 at 0.53%. (THREAD)
A stunning disconnect: Even though the economy has roundtripped back to full capacity and inflation continues to run hot well beyond what was first considered transitory, the market does not expect the Fed to return to a neutral policy stance for years to come—if ever. /2
Consider the implications: Below, we see the neutral rate (R-star), the inflation-adjusted Fed Funds rate (blue), and the inflation-adjusted Fed Funds Shadow rate (which accounts for balance sheet shenanigans). /3
Bitcoin in recent weeks has beautifully fulfilled its premise as a hedge against declining purchasing power. (THREAD)
The chart above shows a hypothetical portfolio with 98% intermediate bonds and 2% Bitcoin. Even a small Bitcoin allocation could protect a conservative bond investor against a loss of purchasing power resulting from rising inflation and financial repression. /2
In 2018, the 2% allocation would have added almost 4 points of annualized volatility, while also amplifying drawdowns (i.e. the opposite of what a diversifier should do). But... /3