DLocal $DLO 3Q21 Earnings 🚀
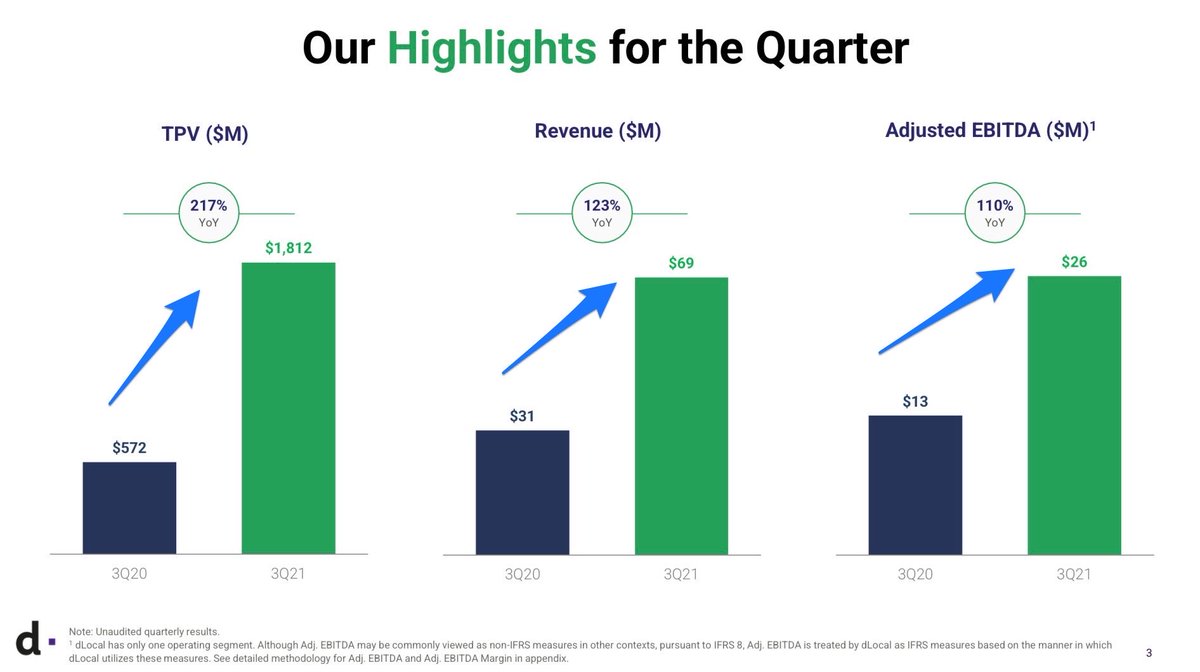
- TPV $1.8b +217% 🚀
- TPV ratio/take-rate 3.8% -30bps QoQ ↘️
- Rev $69m +123% 🚀
- Adj EBITDA $26m +110% 🚀 margin 38% ⭐️ -211bps ↘️
- NG Net Income $20m +129% 🚀 margin 29% ⭐️ +89bps ↗️
- High Net Retention 185% ⭐️
- TPV $1.8b +217% 🚀
- TPV ratio/take-rate 3.8% -30bps QoQ ↘️
- Rev $69m +123% 🚀
- Adj EBITDA $26m +110% 🚀 margin 38% ⭐️ -211bps ↘️
- NG Net Income $20m +129% 🚀 margin 29% ⭐️ +89bps ↗️
- High Net Retention 185% ⭐️
1 | Strong Q3
“We continue to see strong growth across multiple verticals as we see local economies continue to bounce back and global merchants prioritize their efforts in emerging markets.”
“We continue to see strong growth across multiple verticals as we see local economies continue to bounce back and global merchants prioritize their efforts in emerging markets.”

2 | $DLO solving the problem of EM payments complexity

3 | Dlocal ➡️ many clients across increasing multiple countries and payment methods
- 2Q21: 7 countries, 69 pymt methods ↗️
- 2Q21: 7 countries, 62 pymt methods ↗️
- 1Q21: 6 countries, 53 pymt methods ↗️
- 2Q21: 7 countries, 69 pymt methods ↗️
- 2Q21: 7 countries, 62 pymt methods ↗️
- 1Q21: 6 countries, 53 pymt methods ↗️

4 | Existing clients drive growth.
“…to solve their existing needs and cross-sell new payment methods, new countries, and new productive cases.
At any given time…have
- >50 pricing proposals ✅
- 40+ agreement ✅
- 30+ in testing stage ✅
- 20+ waiting to go live ✅
“…to solve their existing needs and cross-sell new payment methods, new countries, and new productive cases.
At any given time…have
- >50 pricing proposals ✅
- 40+ agreement ✅
- 30+ in testing stage ✅
- 20+ waiting to go live ✅

5 | New clients feed the sales funnel.
At a given time, we have about:
- 175+ in the early stages ✅
- 75+ plus waiting to go live ✅
➡️ Once live, typically takes 3-6 quarters to ramp up volume with the merchant.
➡️ Onboarded 10 plus new merchants this quarter.”
At a given time, we have about:
- 175+ in the early stages ✅
- 75+ plus waiting to go live ✅
➡️ Once live, typically takes 3-6 quarters to ramp up volume with the merchant.
➡️ Onboarded 10 plus new merchants this quarter.”

6 | Together Existing and New Merchants currently drive high NRR of 185% and low to zero Churn.
“…our net revenue retention is driven by having minimal levels of churns of less than 1%…”
“…our net revenue retention is driven by having minimal levels of churns of less than 1%…”

7 | Net Retention - 150-160% (ST 12-18mths), 120-130% (LT)
“…we still think that in the near term, which is 12 to 18 months, 150%-160% net retention rate is achievable and that's what we are planning for.
…guided…long term, it will probably come down to 120%-130%.”
“…we still think that in the near term, which is 12 to 18 months, 150%-160% net retention rate is achievable and that's what we are planning for.
…guided…long term, it will probably come down to 120%-130%.”
8 | Countries - Adding Thailand & El Salvador

9 | Lower Take Rates
…3.8% versus 4.1%…large merchants with a take rate lower than average have grown significantly.
…great for our business as they bring incremental EBITDA.
➡️ Not optimizing for take-rate
➡️ Take rate will fluctuate
➡️ Optimise not margins but profits
…3.8% versus 4.1%…large merchants with a take rate lower than average have grown significantly.
…great for our business as they bring incremental EBITDA.
➡️ Not optimizing for take-rate
➡️ Take rate will fluctuate
➡️ Optimise not margins but profits
10 | EBITDA Margins - Range 40%+/- not specific number
“..expect the margin to be in and around that level…not tying ourselves to a specific number, it's a range…
…don't want to say is that it's definitely going to be a 40% number. It's going to be in that range…”
“..expect the margin to be in and around that level…not tying ourselves to a specific number, it's a range…
…don't want to say is that it's definitely going to be a 40% number. It's going to be in that range…”

11 | Declining Customer Concentration Risk to Top 10 ✅
“…our revenues exposure to our top 10 merchants continuous decreasing from 62% in the 2Q21 to 57% in 3Q21.”
“…our revenues exposure to our top 10 merchants continuous decreasing from 62% in the 2Q21 to 57% in 3Q21.”
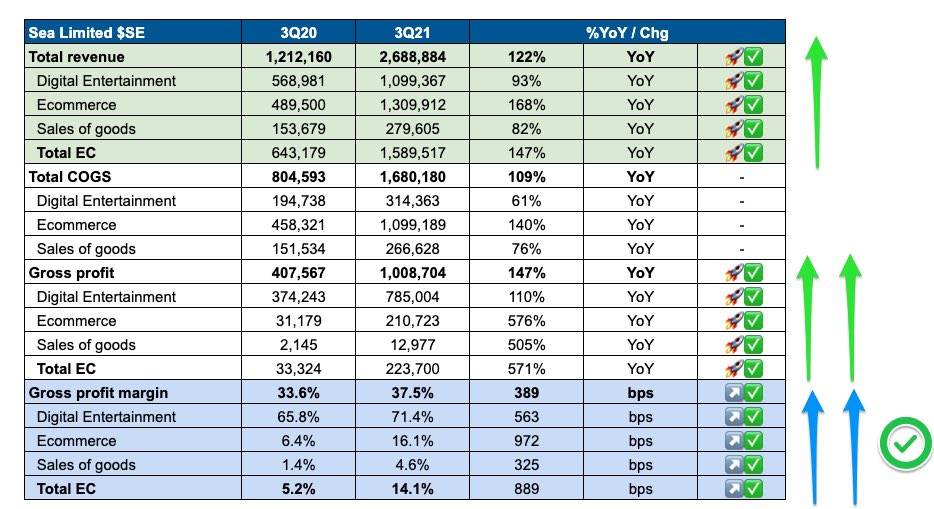
12 | Declining Cost of Services
“3Q20 was 2.4% of TPV… 3Q21 was 1.9%…decrease is the result of efficiencies & changes in biz mix.”
…transaction costs have continuously declined…might see them going up… function of processing payments in countries or payment methods…”
“3Q20 was 2.4% of TPV… 3Q21 was 1.9%…decrease is the result of efficiencies & changes in biz mix.”
…transaction costs have continuously declined…might see them going up… function of processing payments in countries or payment methods…”
12 | Focus is on Net Retention and Absolute Profits
So, we continue to optimize for NRR, making sure that we are bringing more additional dollars that come at a profit. And yes, definitely, we are constantly getting better rate from acquirers, from payment methods, from banks.
So, we continue to optimize for NRR, making sure that we are bringing more additional dollars that come at a profit. And yes, definitely, we are constantly getting better rate from acquirers, from payment methods, from banks.
Final Takeaway on dLocal $DLO:
➡️ Strong results, thesis unchanged. Rare combination of rapid growth & very strong profitability at scale (API), high insider ownership (>40%), well-diversified, deep integration (sticky & high switching cost), solid up+cross-sell.
➡️ Strong results, thesis unchanged. Rare combination of rapid growth & very strong profitability at scale (API), high insider ownership (>40%), well-diversified, deep integration (sticky & high switching cost), solid up+cross-sell.
Attached my earlier update on Dlocal’s $DLO 2Q21 earnings 👇🏻
https://twitter.com/EugeneNg_VCap/status/1428116840438325248
• • •
Missing some Tweet in this thread? You can try to
force a refresh