Keen for a quick range play technique but not 100% on using PA without some guidance?
Then read on folks, this will help 100%
Agenda for this one is:
- Range set up
- Range play
- Opportunities
- EMA's
- Conclusion
Then read on folks, this will help 100%
Agenda for this one is:
- Range set up
- Range play
- Opportunities
- EMA's
- Conclusion

Range Set Up
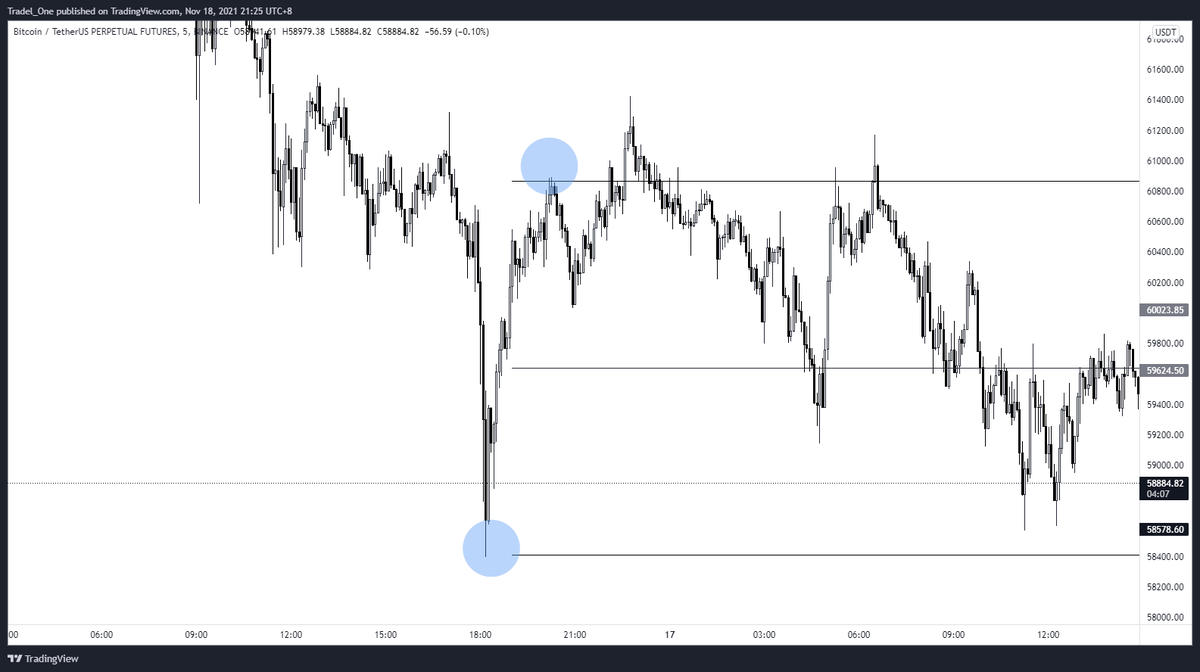
What I did to set up my ranges is pull a fib from the swing low of the range to the immediate swing high following this move
What I did to set up my ranges is pull a fib from the swing low of the range to the immediate swing high following this move
Range Play
Liquidity swept from range high, with a market structure break of a swing low that then sees a retest of the range high / confluence with entry fibs
Even a simple move like this could net 2.81R
Liquidity swept from range high, with a market structure break of a swing low that then sees a retest of the range high / confluence with entry fibs
Even a simple move like this could net 2.81R


Opportunities
With the range low tapped, and such fast moving PA, we can expect a 0.5 retracement of a local range, which in this case coincides with the 0.5 level of the overall range we're playing in
With the range low tapped, and such fast moving PA, we can expect a 0.5 retracement of a local range, which in this case coincides with the 0.5 level of the overall range we're playing in

Another opportunity could have been to enter on the retest of mid range after the market structure break, aiming for the 0 level on the fibs that also aligns with the FRVP up to the point of the move

And one last one for this thread is the possibility of the below.
Remember - you'll trade the range, but the arse of it will fall out of it on you at one point.
Ie you will lose a run playing the range, but you would have made up for this if you use this technique
Remember - you'll trade the range, but the arse of it will fall out of it on you at one point.
Ie you will lose a run playing the range, but you would have made up for this if you use this technique

EMA's
If you slap the 21 & 50 EMA's on, you'll also notice (if you aren't comfy with PA on it's own) that each of these plays are made with the trend.
Eg, the first move is made when the 21 EMA is under the 50EMA / bearish. The long is made when the opposite is true
If you slap the 21 & 50 EMA's on, you'll also notice (if you aren't comfy with PA on it's own) that each of these plays are made with the trend.
Eg, the first move is made when the 21 EMA is under the 50EMA / bearish. The long is made when the opposite is true

Conclusion
So that's it. Short and sweet - just got to play it as you see it, and the EMA's will certainly help you out as well with confimation etc.
Hopefully this helps you, your mates, or your uncle Robbo's best mate Johnno
Either way, I know you'll find some value here
So that's it. Short and sweet - just got to play it as you see it, and the EMA's will certainly help you out as well with confimation etc.
Hopefully this helps you, your mates, or your uncle Robbo's best mate Johnno
Either way, I know you'll find some value here
Thanks as always to @Delta_Exchange for their support, and if you want to trade, use the below link
No stress at all, it just helps me bring these little tutorials to you all
delta.exchange/MindsetBTC
Cheers
No stress at all, it just helps me bring these little tutorials to you all
delta.exchange/MindsetBTC
Cheers
• • •
Missing some Tweet in this thread? You can try to
force a refresh