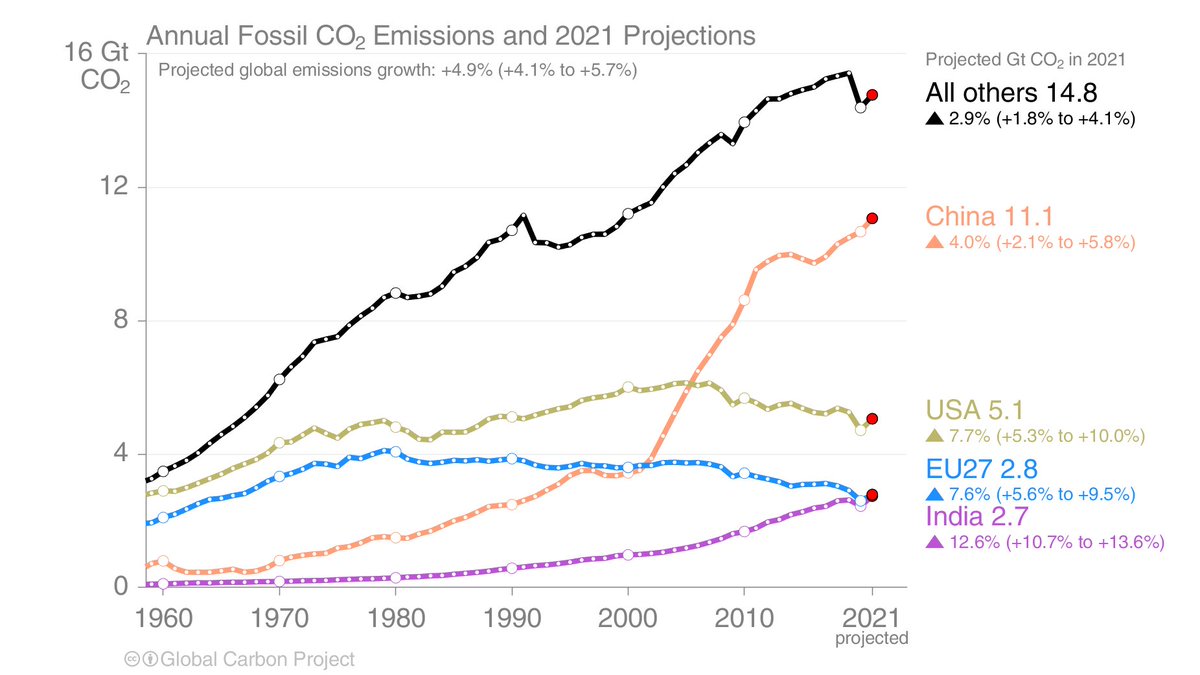
Did you raise an eyebrow when you heard confident projections during #COP26 of global warming in 2100 if we follow current policies (~2.6°C)?
Surely, surely, there must be more uncertainty?
Well, yes, we coincidentally have a new paper on that!
nature.com/articles/s4155…
1/🧵
Surely, surely, there must be more uncertainty?
Well, yes, we coincidentally have a new paper on that!
nature.com/articles/s4155…
1/🧵
A bit of background...
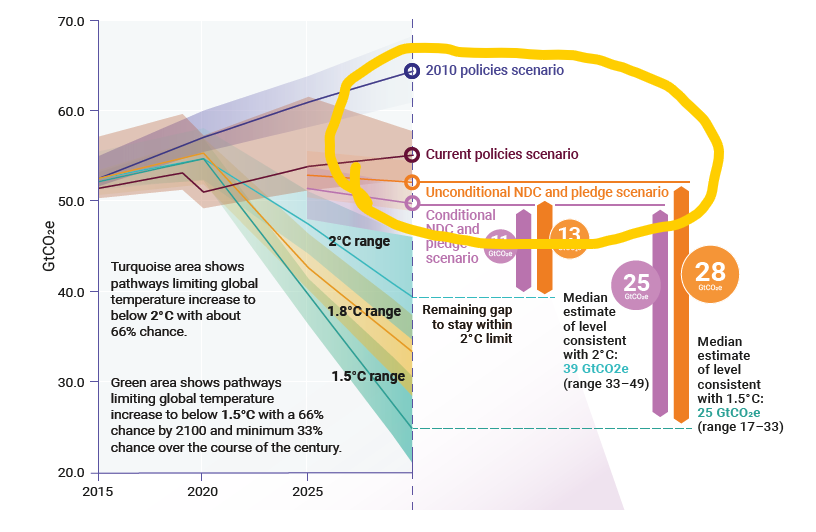
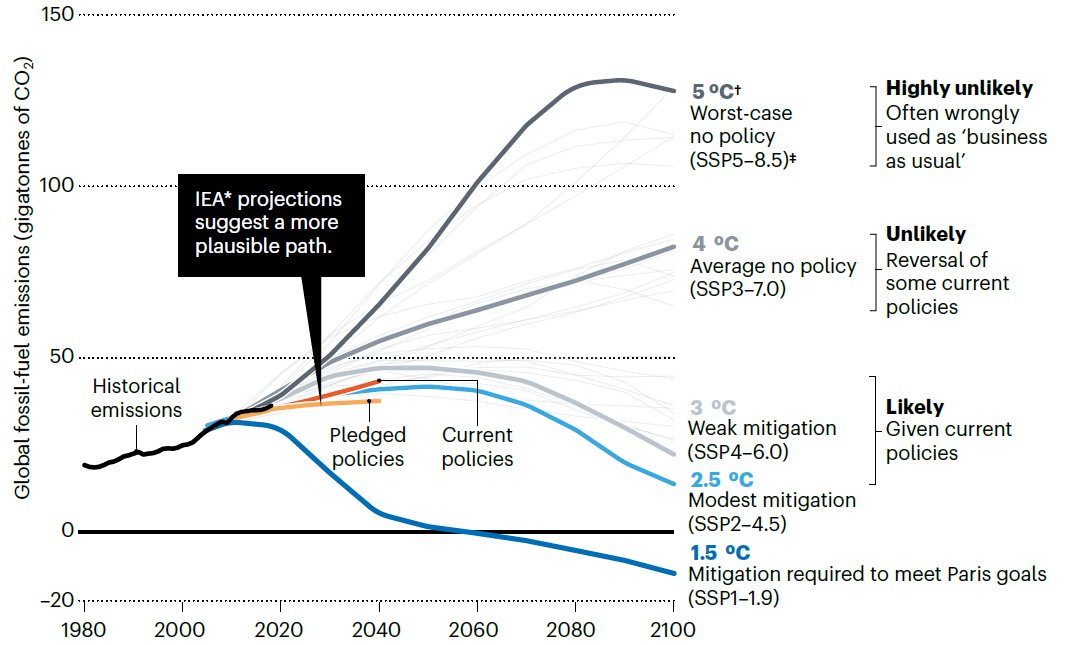
Some of us have been arguing there should be much more focus on scenarios that consider "where we are heading" with current policies or pledges.
This is harder to model then 'no climate policy' baselines, but it is essential!
nature.com/articles/d4158…
2/
Some of us have been arguing there should be much more focus on scenarios that consider "where we are heading" with current policies or pledges.
This is harder to model then 'no climate policy' baselines, but it is essential!
nature.com/articles/d4158…
2/
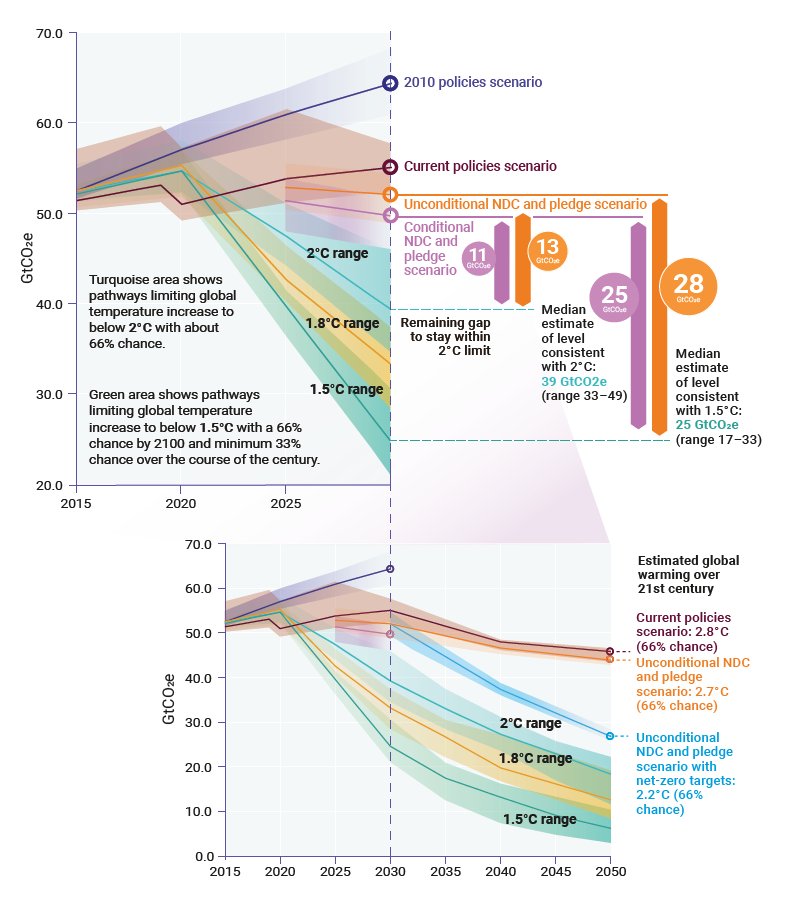
These current policy or NDC projections have been a mainstay of the @UNEP Emissions Gap Report & @climateactiontr.
These approaches have been based on statistical matching with existing scenario databases.
We wanted to used models to extend 2030 policies & pledges to 2100.
3/
These approaches have been based on statistical matching with existing scenario databases.
We wanted to used models to extend 2030 policies & pledges to 2100.
3/
(noting that EGR now does a different approach more similar to our paper, other projects have extended current policies & NDCs such as in CD-LINKS & ADVANCE, the difference is we focus on the issue)
/3b
/3b
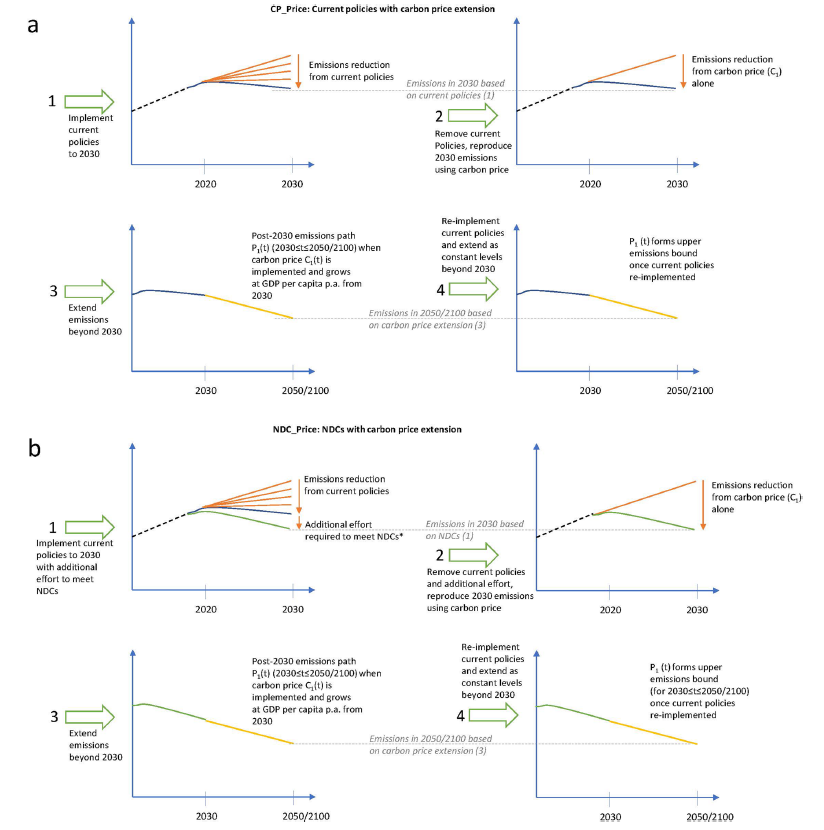
But, how do you extrapolate policy effort from 2030 to 2100, & in a way that can cover the mechanics of a diverse set of models.
We came up with two approaches, extrapolating based on carbon price extensions & extrapolating based on emission intensity projections.
4/
We came up with two approaches, extrapolating based on carbon price extensions & extrapolating based on emission intensity projections.
4/
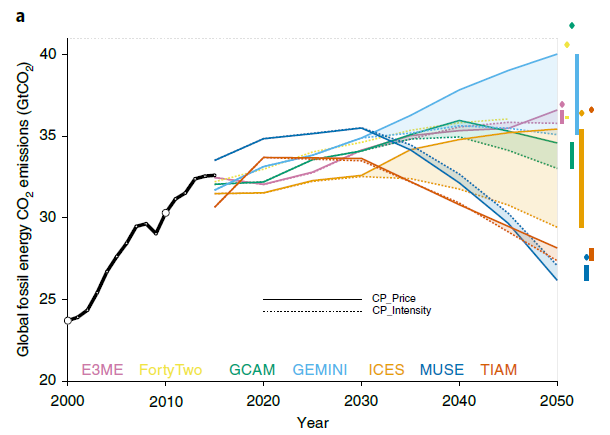
Even though we harmonised many input data & assumptions across out models, there is a very large spread in temperature outcomes.
We used a diverse set of models, so focused on CO₂ emissions, had to extend some to 2100, & estimated temperature using simplified approaches.
5/
We used a diverse set of models, so focused on CO₂ emissions, had to extend some to 2100, & estimated temperature using simplified approaches.
5/
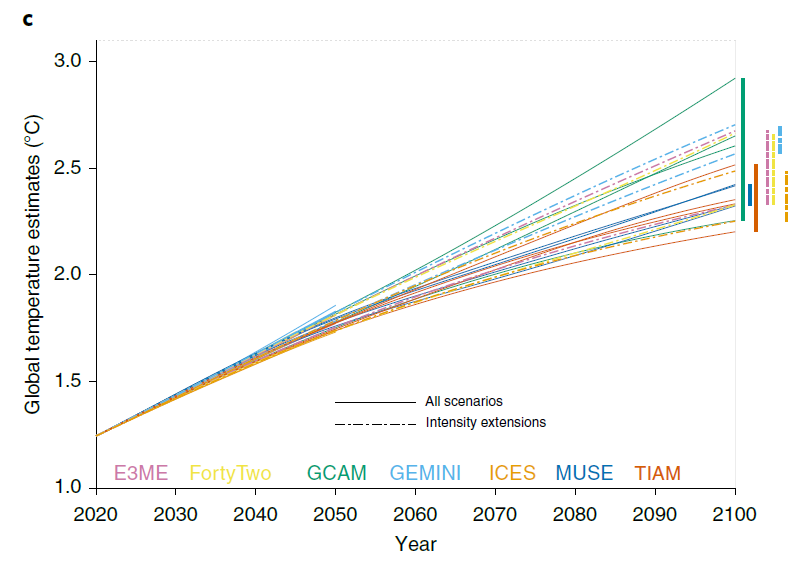
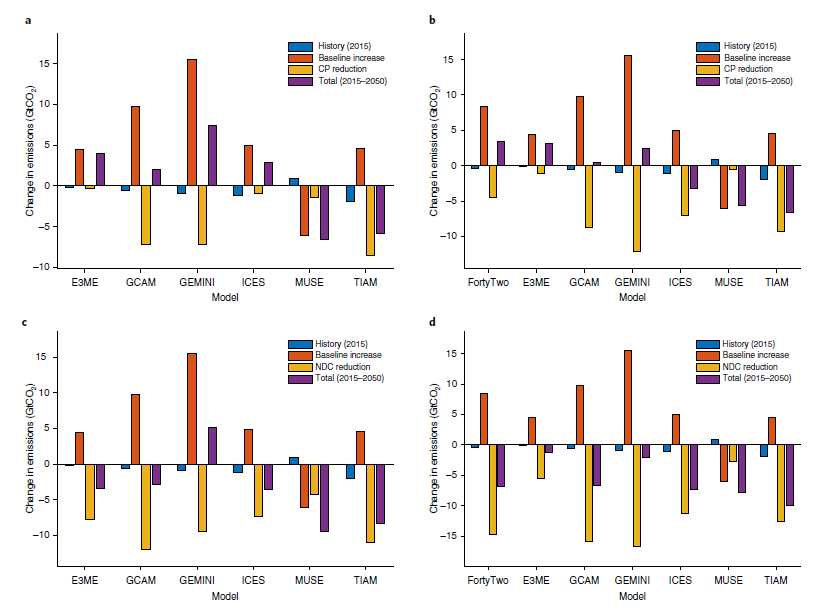
But why the spread in results?
Different models have different baseline 'no climate policy' emissions (red) & different response to climate policy (yellow), & these factors dominated the differences.
6/
Different models have different baseline 'no climate policy' emissions (red) & different response to climate policy (yellow), & these factors dominated the differences.
6/
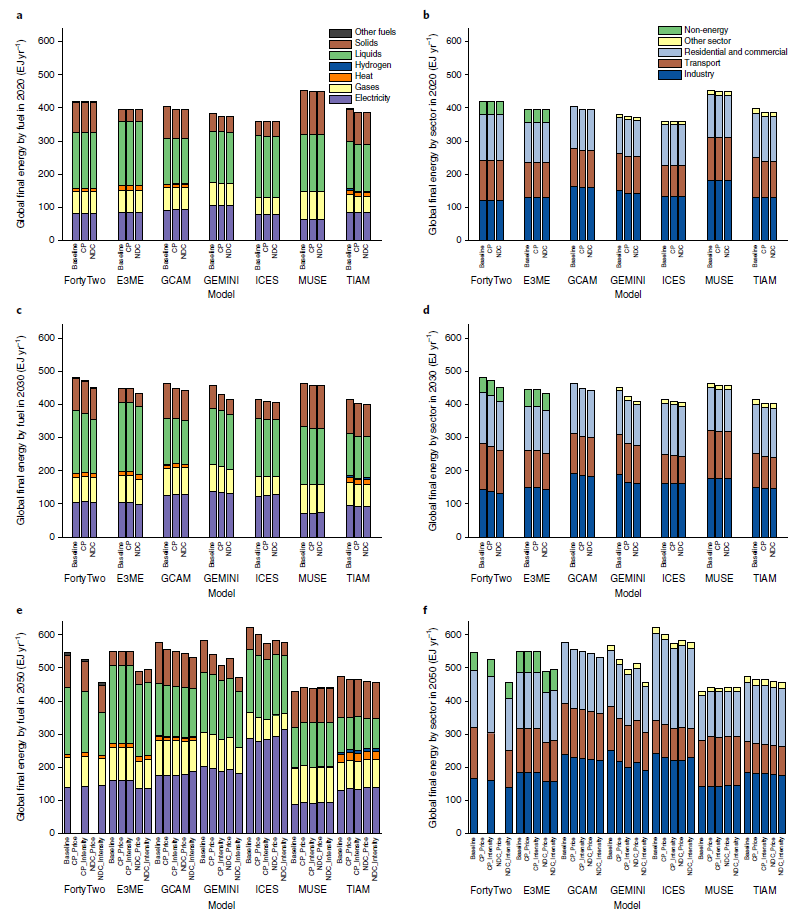
We also took some effort to try & explain the results, here for final energy, but without dedicated & specific model-by-model analysis it is perhaps hard to isolate differences. We did not find any strong evidence of model type, structure, etc, pushing results either way.
7/
7/
The first question on many lips is "how much CCS" (well, my first question).
We run each model with current policies, & a carbon price which gives the same emissions as the current policies, & found that the carbon price leads to much greater deployment of CCS.
8/
We run each model with current policies, & a carbon price which gives the same emissions as the current policies, & found that the carbon price leads to much greater deployment of CCS.
8/
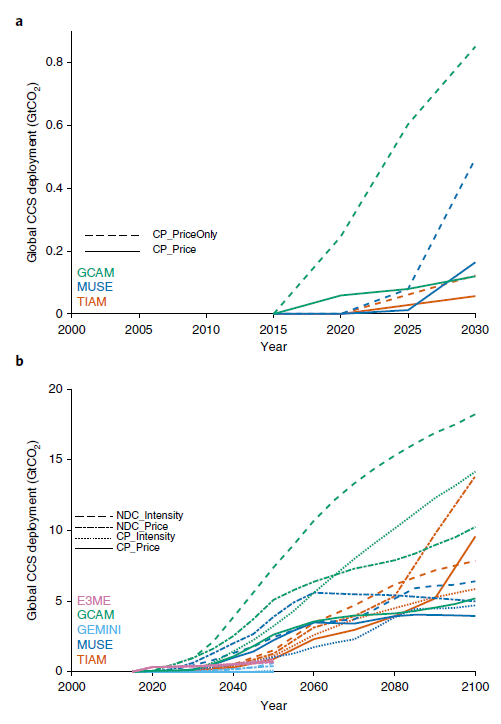
This indicates that the evolution of the energy system is very dependent on the types of policies implemented, notably whether a carbon price versus a regulation, standard, incentive, etc.
Most scenarios are based around carbon prices, & so high levels of CCS may follow...
9/
Most scenarios are based around carbon prices, & so high levels of CCS may follow...
9/
Have a look at the paper, there is much more detail than in this thread!
Many interesting aspects to explore. Up next, carbon-climate feedbacks? Maybe...
Thanks to @idasogn & the @ParisReinforce team!
nature.com/articles/s4155…
10/10
Many interesting aspects to explore. Up next, carbon-climate feedbacks? Maybe...
Thanks to @idasogn & the @ParisReinforce team!
nature.com/articles/s4155…
10/10
@idasogn @ParisReinforce And here is a free link to view the paper... rdcu.be/cBOBr
In case it was not clear, the 2.2-2.9°C range is the median temperature outcome across the models used. If we additionally include climate uncertainty via the TCRE, the range becomes 1.7-3.8°C.
In case it was not clear, the 2.2-2.9°C range is the median temperature outcome across the models used. If we additionally include climate uncertainty via the TCRE, the range becomes 1.7-3.8°C.
• • •
Missing some Tweet in this thread? You can try to
force a refresh