"Everyone wants to keep the dream of 1.5°C alive. In every practical sense you are kidding yourself if you think that we are remotely heading towards 1.5°C"

So why the optimism? #COP26

businessgreen.com/feature/403897…

1/
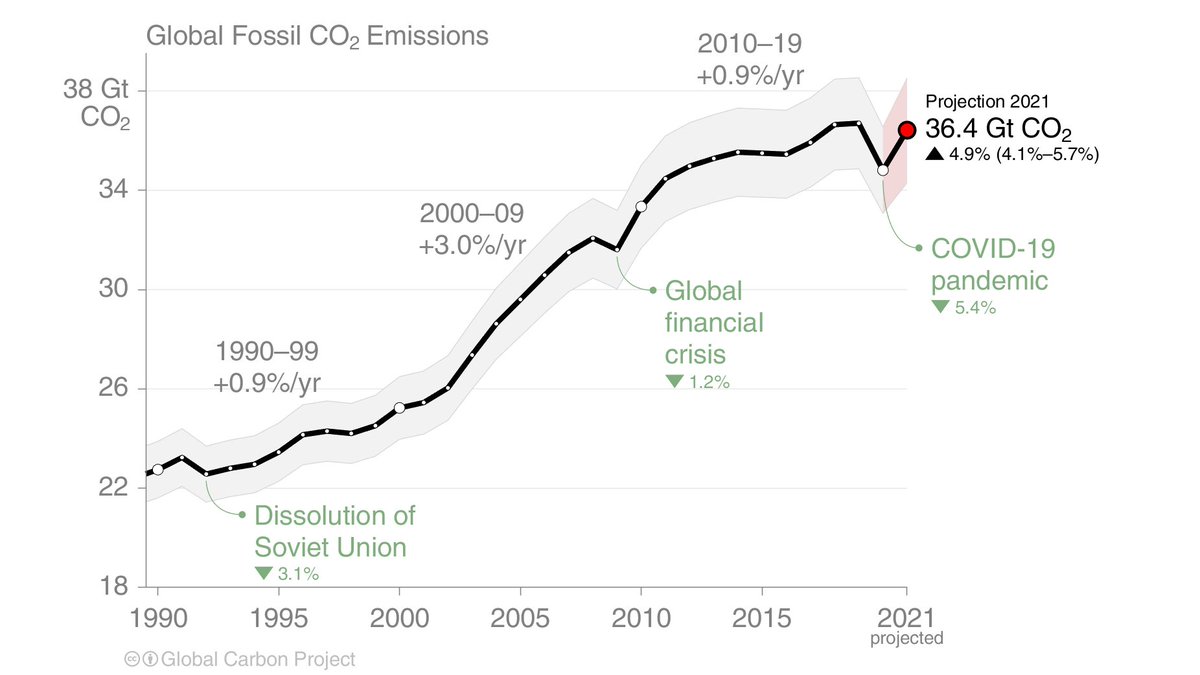
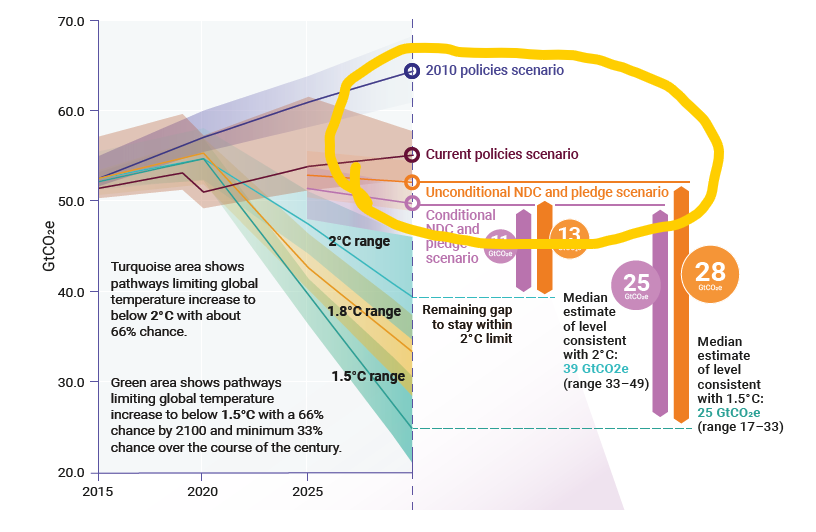
The world has made progress from where we were 10 years ago (2010), but on the “current policy scenario” emissions will continue to rise.

According to UNEP EGR, emissions will remain flattish to 2030, if governments implement the necessary policies.

unep.org/resources/emis…

2/
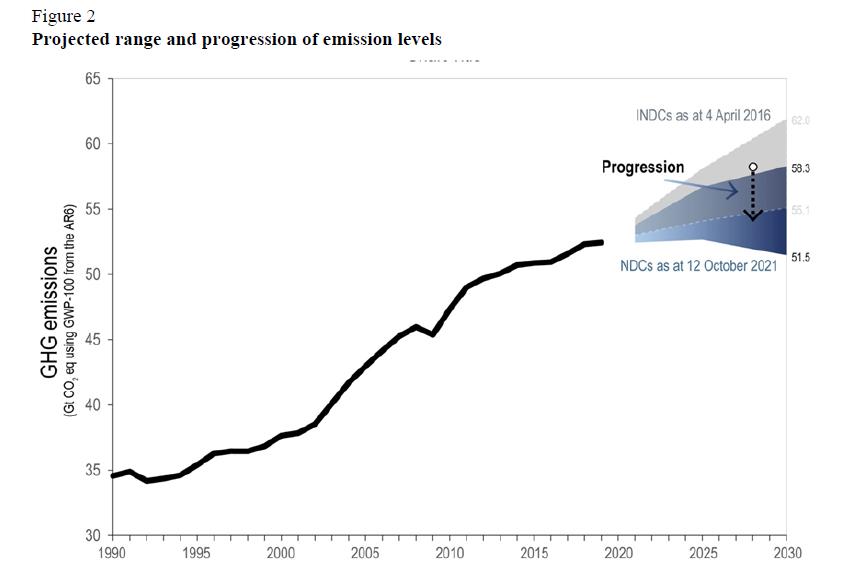
The UNFCCC Synthesis Report says NDCs will lead to a 5% rise in emissions from 2019 to 2030. This is 16% above 2010 levels, as opposed to ~50% below as required for <1.5C.
unfccc.int/news/updated-n…

3/
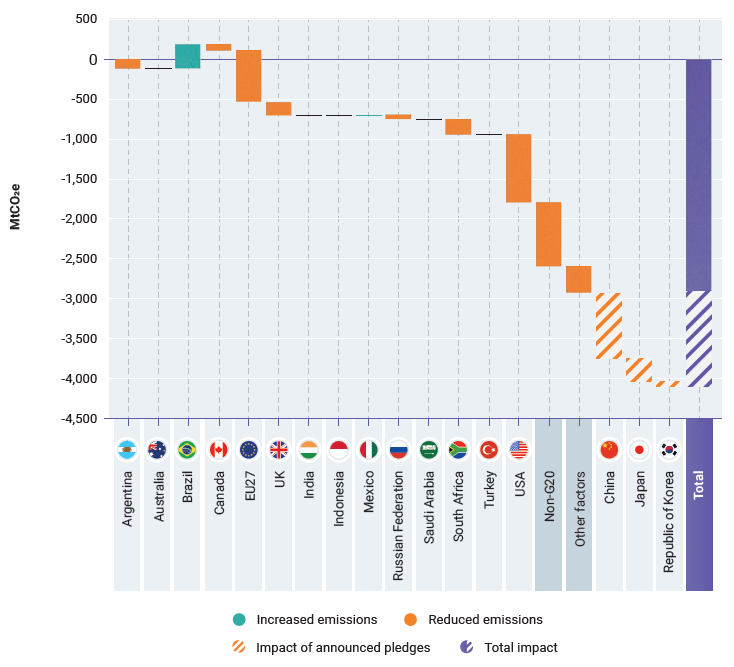
Ambition has gone up, mainly through raised ambition in the US, EU, and China (the big emitters) with minor changes from other big emitters. These ambitions need to be matched with policy. As seen in some countries, this is not easy...
unep.org/resources/emis…

4/
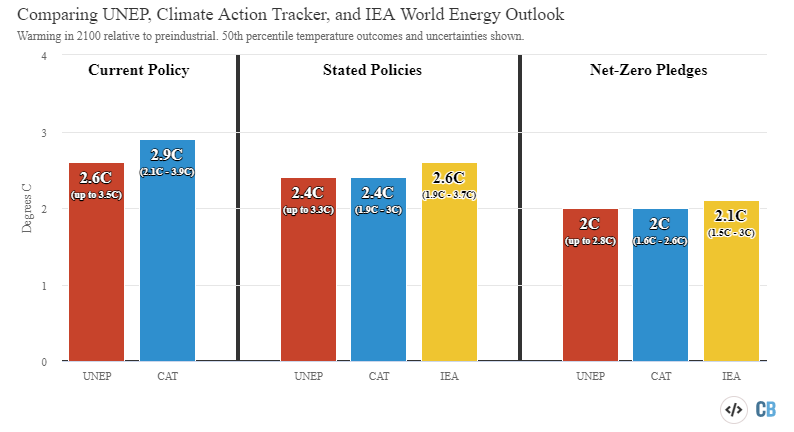
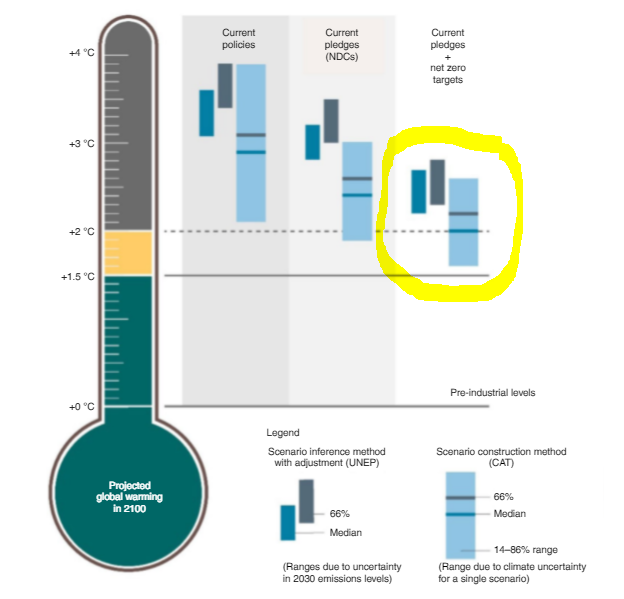
This all means the world is heading to about 2.5C in 2100, from which the temperature will keep rising after 2100.

This is not 5°C, nor 4°C, not even 3°C. But, it needs policies for that to happen. It is not a given.

carbonbrief.org/unep-current-c…

5/
Countries have high ambition. We have been sucked into the rhetoric of governments. If governments implement policies to mach ambition, we could be good for ~2°C. Of course, this is great, but lots needs to happen.
go.nature.com/3A3nIAs

6/
Optimism is high because countries are making pledges, keeping the dream alive.

If we want to solve the climate problem, what matters most is what countries are doing TODAY.

Be optimistic when meaningful policies get implemented...

7/7

• • •

Missing some Tweet in this thread? You can try to force a refresh
 

Keep Current with Glen Peters

Glen Peters Profile picture

Stay in touch and get notified when new unrolls are available from this author!

Read all threads

This Thread may be Removed Anytime!

PDF

Twitter may remove this content at anytime! Save it as PDF for later use!

Try unrolling a thread yourself!

how to unroll video
  1. Follow @ThreadReaderApp to mention us!

  2. From a Twitter thread mention us with a keyword "unroll"
@threadreaderapp unroll

Practice here first or read more on our help page!

More from @Peters_Glen

4 Nov
GLOBAL CARBON BUDGET 2021 🧵

After dropping 5.4% in 2020, global fossil CO₂ emissions are expected to increase 4.9% [4.1-5.7%] in 2021, finishing just 0.8% below 2019 emission levels.

globalcarbonproject.org/carbonbudget/i…

1/ Image
Coal & gas are now back above their pre-pandemic (2019) levels, while oil remains suppressed.

Assuming oil returns to 2019 levels in the next year or two, a drop in coal use is required to avoid further emissions growth.

2/ Image
China grew in 2020 & especially 2021, now with solid growth since 2016.

Other major countries had a rebound which puts them back on their decade trends.

The recovery is also uneven across smaller countries (all others).

3/ Image
Read 12 tweets
14 Oct
THREAD🧵

Is it time to move beyond net zero emissions & start discussing net negative emissions?

Why? To allow developing countries to reach net zero later (fairness) & help them escape poverty while still limiting warming to 1.5°C.

@aniruddh_mohan sciencedirect.com/science/articl…

1/
The carbon budget for 1.5°C is depleting rapidly, with a large share used by today’s developed countries.

Even if developed countries mitigate fast, the carbon space remaining for developing countries is minuscule.

(also see cicero.oslo.no/no/posts/cicer…)

2/
If global CO₂ emissions stay at net zero, either:
* All countries need to be net zero ~2050, or
* Rich countries have net negative emissions post-2050, allowing developing countries to emit longer post-2050.

3/
Read 12 tweets
13 Oct
Did you know that 30% of cumulative CO₂ emissions are from land-use change?

If the starting point is 1750 or earlier, this share just goes up.

essd.copernicus.org/articles/12/32…

1/ Image
Another factoid. Half of global CO₂ emissions in 1950 were from land-use change. That is not so long ago!

The declining share of land-use change in the total is not because the world ended deforestation, but coal, oil, & gas grew.

2/ Image
CO₂ emissions from land-use change are incredibly uncertain. Uncertainty is 50% or more.

There are also definition issues in what is defined as anthropogenic (what is a carbon sink?).

3/ Image
Read 5 tweets
8 Oct
"Instead of leaving such work to volunteers, global institutions should marshal the funding & expertise to collect crucial data, & mandate their publication"

💯agree with @_HannahRitchie. No one wants to fund the giant who's shoulders we stand on.

1/

nature.com/articles/d4158…
The approach to science is to fund big models, expensive observations, etc. All this is needed, but somehow science seems to have forgotten the importance careful curation & maintenance of data.
2/
Science is full of projects that improve models, do model comparisons, process some satellite data, etc, & if you are lucky there might be a task that scrapes together some data to feed the models.
3/
Read 10 tweets
7 Oct
It is a top day for a top ten day...

We often do plots of the top emitters, especially for fossil CO₂ emissions. But, what about other GHGs? Is it the same distribution of top emitters?

We need a thread for that...

(I know about per capita, so no need to @ me)

1/
CO₂ emissions from net LUC (one bookkeeping model). These are net numbers, some countries are net sources, others net sinks.

Current LUC sources are concentrated in several developing countries (the rich countries cut their forests down long ago).

2/

agupubs.onlinelibrary.wiley.com/doi/full/10.10…
Don't over interpret the LUC numbers.

Different LUC datasets give different numbers. Here is the FAO data (from 2020). Indonesia is much less important in this dataset, Brazil dominates.

There is a lot of uncertainty at the country level, so be careful.

3/
Read 10 tweets
22 Sep
#ClimateTwitter Direct Air Capture (DAC)

In 2011, Rob Socolow estimated that 1MtCO₂/yr DAC would require a contact structure with height 10m & length of 5km.

Is that still the case?

1/

aps.org/policy/reports…
If I look at these pictures of Climeworks Orca via @EdgarHertwich

The height is ~3m, the length ~10m, & 4 units
Area: 120m² for 4000tCO₂/yr
Or: 30,000m² for 1MtCO₂/yr (120/4*1000)

If 10m high (Socolow), then contact structure ~3km long.


2/
This is rather crude, but is quite similar to the original Socolow estimate. If true, this is fascinating…

If contact structure is 10m high, then 1MtCO₂/yr requires 3-5km structure

1GtCO₂/yr requires 3-5000km
5GtCO₂/yr requires 15-25,000km

3/
Read 5 tweets

Did Thread Reader help you today?

Support us! We are indie developers!


This site is made by just two indie developers on a laptop doing marketing, support and development! Read more about the story.

Become a Premium Member ($3/month or $30/year) and get exclusive features!

Become Premium

Too expensive? Make a small donation by buying us coffee ($5) or help with server cost ($10)

Donate via Paypal Become our Patreon

Thank you for your support!

Follow Us on Twitter!

:(