What is the Status Quo of the EU gas crisis?
A short thread in charts on why we are here & where the EU gas crisis is aheading next.
Summary: EU gas security is a prayer, not a policy!
1/...
A short thread in charts on why we are here & where the EU gas crisis is aheading next.
Summary: EU gas security is a prayer, not a policy!
1/...
As of today, EU gas storage tanks are 72% filled. This is WELL below its 5-year averages.
2/...
2/...

Expressed in Terra Watt Hours (TWh), the EU has 809 TWh of storage as at 21 November 2021.
For perspective: In the winter 2017/18, the EU consumed 770 TWh from 1 Nov 2017 - 31 March 2018.
Gas storage couldn't go that low bc pipeline systems needs to stay under pressure.
3/...
For perspective: In the winter 2017/18, the EU consumed 770 TWh from 1 Nov 2017 - 31 March 2018.
Gas storage couldn't go that low bc pipeline systems needs to stay under pressure.
3/...

There are three MAIN reasons why EU storage tanks are well below their averages at the start of the winter season. There are smaller reasons which we disregard.
1. Gazprom did not fill its EU storage tanks in Germany, Austria and the Netherlands.
4/...
1. Gazprom did not fill its EU storage tanks in Germany, Austria and the Netherlands.
4/...
https://twitter.com/BurggrabenH/status/1456712781235990535?s=20
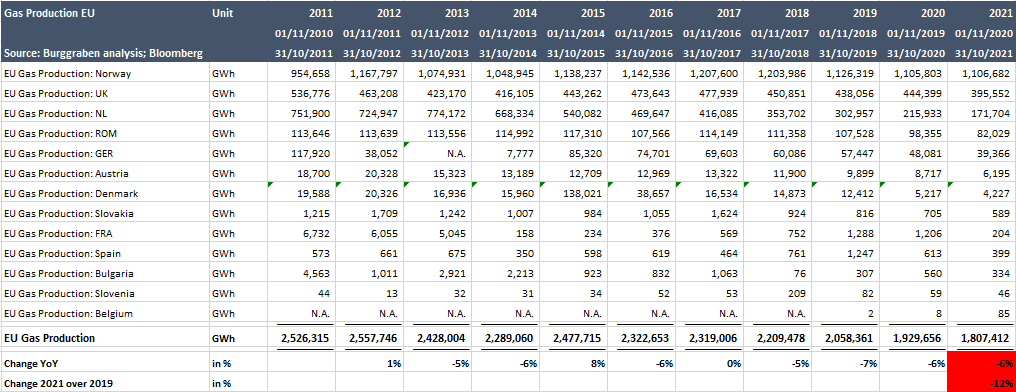
The 2nd reason is that EU produced 12% less gas when compared to 2019 (pre-Covid) due to NL's Groningen field reduction (quota production due to earthquates) & natural field declines in UK. These declines are structural, not seasonal. Only Norway re-invests in production.
5/...
5/...
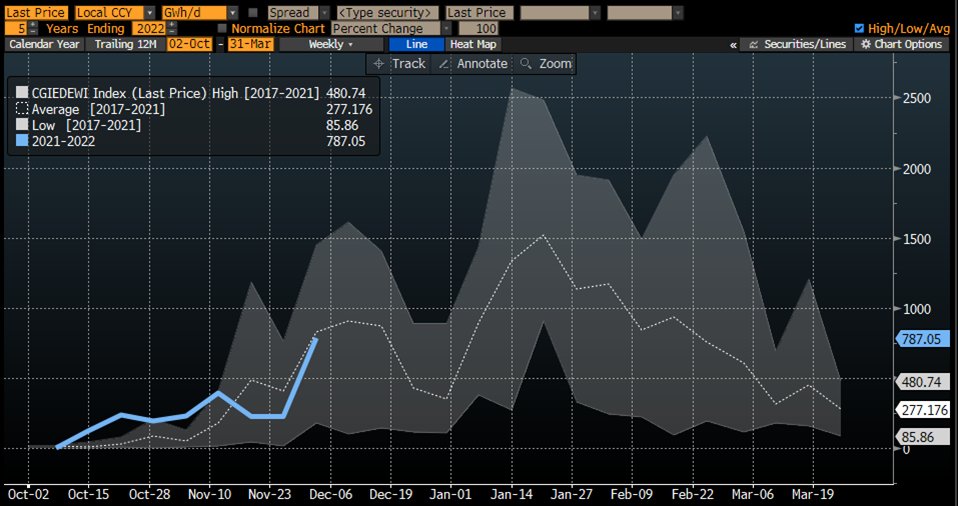
The 3rd reason: 14% less LNG imports when compared seasonally. Is that structural? It depends! Fact is that Asia will continue to try to out-bid the EU for EVERY SINGLE marginal LNG tanker as its natural gas demand needs to replace coal. Maybe @OKalleklev wants to comment?
6/...
6/...

So let us now look at how the EU is withdrawing its gas from a seasonal perspective.
Answer: We are withdrawing gas quickly from a 5-year average perspective.
7/...
Answer: We are withdrawing gas quickly from a 5-year average perspective.
7/...

Is that overcompensated by over-proportational injection rates for the time of the season. Answer: not at all...!
8/...
8/...

Who is withdrawing gas faster than usual. France, the 2nd largest gas consumer, certainly is.
9/...
9/...

But Italy is also quick to withdraw seasonally.
10/...
10/...

Germany is below average for now. But winter has now arrived in the south. So this may well change rather quickly.
11/...
11/...
Austria, the gas hub for Central & Eastern Europe is also increasing withdrawals at a fast clip now.
12/...
12/...

So, going forward, the only thing that matters for EU gas is the weather forecast. If the weather is colder than 2017/18, TTF will go literally to the moon from here bc demand must be destructed.
What is the forecast right now? For Central Europe, as of today the forecast below
What is the forecast right now? For Central Europe, as of today the forecast below

North West Europe? Slightly below average temps (red line vs green line).
14/...
14/...

The Nordics? About average cold, with an above average mid-December.
15/...
15/...

Mediterranean Europe (Italy, Spain, et al)...below average cold for next 35 days.
16/..
16/..

In sum, withdrawals are ahead while weather indicates avg cold. Yet, TTF will not calm due storage % & price convergence with Asia (marginal LNG gas barrel). If weather forecast go below avg, TTF will go higher.
17/17 (thx, pls share)
17/17 (thx, pls share)
https://twitter.com/BurggrabenH/status/1456712823673737220?s=20
Just in case you are not familiar with EU gas numbers, here some help in billion cubic meters - BCM (35x more than cubic feet):
#natgas #EU
#natgas #EU
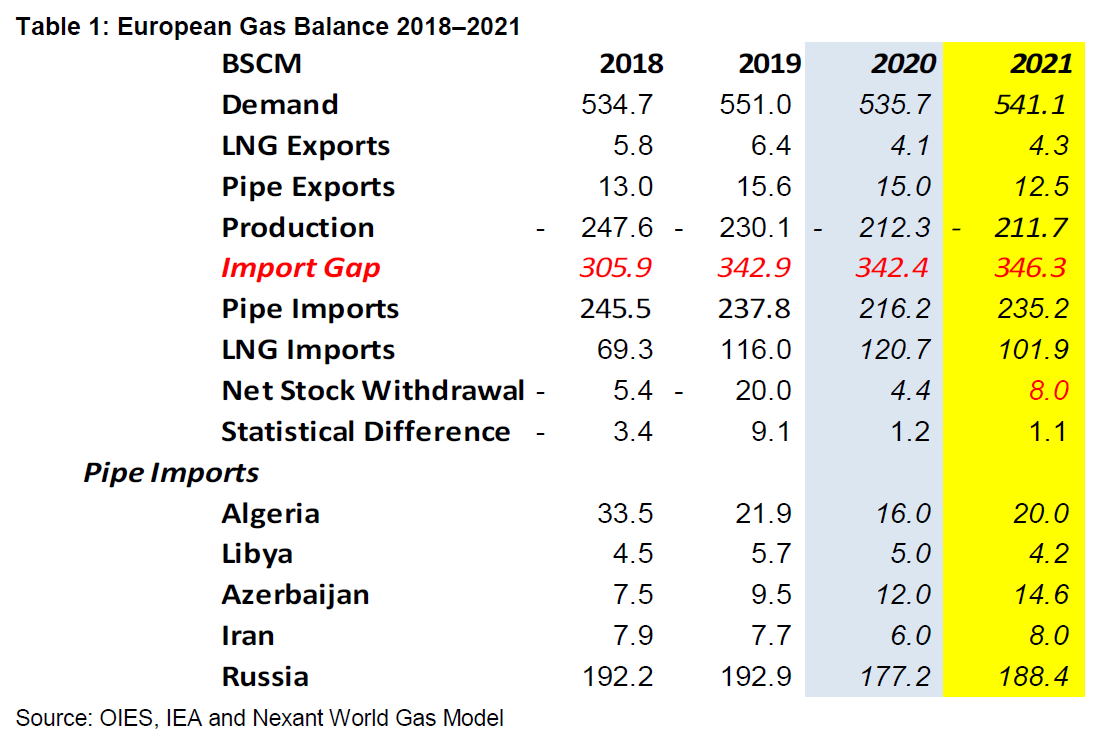
Context: EU = 540bcm market; US = 950bcm; Asia = 700bcm going to 1200bcm by 2040.
Point is: Of the big 3, ONLY US has excess gas. Both EU & Asia depend on pipeline & LNG imports from Russia, Qatar, Africa & Australia. Gas crisis = a structural deficit crisis!
#LNG
Point is: Of the big 3, ONLY US has excess gas. Both EU & Asia depend on pipeline & LNG imports from Russia, Qatar, Africa & Australia. Gas crisis = a structural deficit crisis!
#LNG

So now that u understand that the EU/Asian gas crisis has many structural elements and is not going away, potentially ever, here is one way to express the view as an educated investor…
https://twitter.com/burggrabenh/status/1463828250166280195
By the by, the looming Russian-Ukrainian conflict does not help to calm TTF due to existing pipeline system - ex Nord Stream (Baltic Sea) & Yamal (Belarus) - relying on Ukraine as transit hub to bring natgas from Russia to EU.
https://twitter.com/BurggrabenH/status/1463895222727974918?s=20
Below a EU pipeline map...

• • •
Missing some Tweet in this thread? You can try to
force a refresh