What have you changed in your trading since Mar'20? We saw majority of vol sellers setting a higher bar to enter a trade. But during this period we also found some edge: Despite equity vol finding equilibrium at elevated levels, $SPX autocorrelation averaged < 0. $VIX #ES_F ImageImage
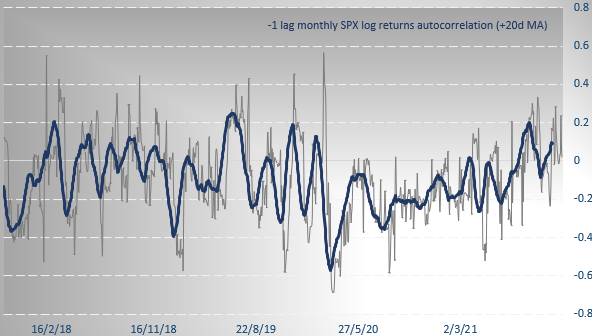
This means that the gamma portion of index options took out the trend. So you had dealers' hedging requirements selling the upticks and buying the dips.
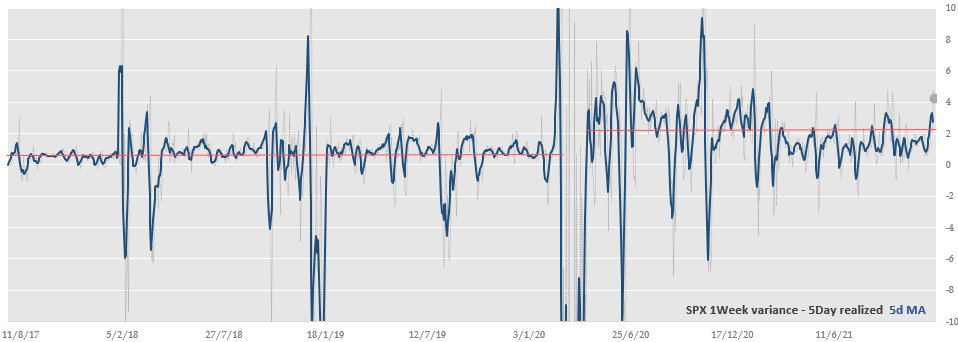
Never in the past had we shorted 1week $SPX variance with such regularity. Image
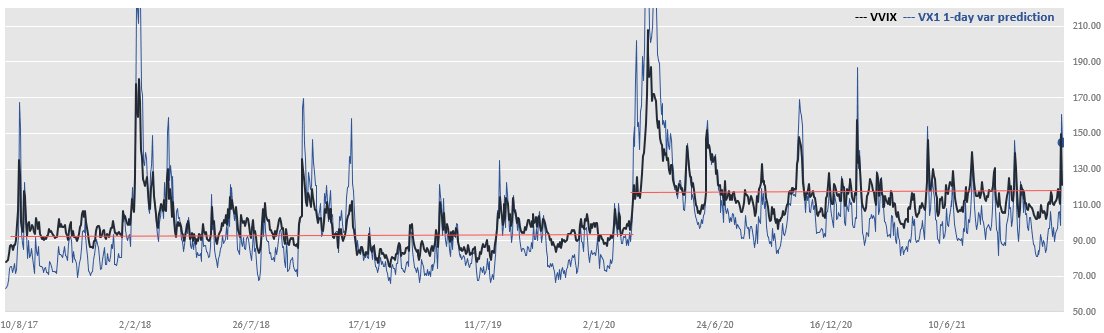
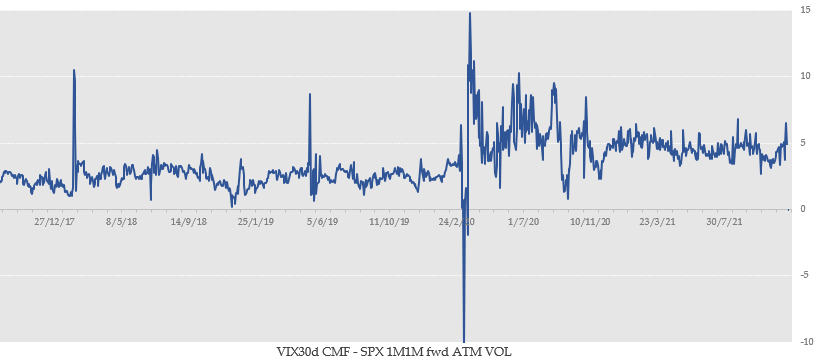
What can end this melt-up in stocks? Mkt ecosystem depends on a Fed put + liquidity. Fed has solved the liquidity issue but not solvency issues. Credit may prove cause of future shocks. And $VIX might follow the credit cycle. We gauge mkt fragility via VIX futures over $SPX IV. Image

• • •

Missing some Tweet in this thread? You can try to force a refresh
 

Keep Current with Yannis Couletsis

Yannis Couletsis Profile picture

Stay in touch and get notified when new unrolls are available from this author!

Read all threads

This Thread may be Removed Anytime!

PDF

Twitter may remove this content at anytime! Save it as PDF for later use!

Try unrolling a thread yourself!

how to unroll video
  1. Follow @ThreadReaderApp to mention us!

  2. From a Twitter thread mention us with a keyword "unroll"
@threadreaderapp unroll

Practice here first or read more on our help page!

More from @couletsis

26 Dec
Jim is a very vixperienced investor, who surely has the answers himself. But I'll bite anyway, so here goes.🧵
There can be no single indicator to time a $VIX or $SPX trade. Even if it were, some machine would have by now already learned how to front-run it. So I'm the last person to suggest there is a publicly available indicator that one may have identified
but everybody else hasn’t. The collective intelligence of the market is the aggregate, not the average. But to answer @vixologist's question, a favorite I always look out to is correlations and vol-of-vol. But that’s just us, and even more so, largely as a signal that triggers
Read 22 tweets
5 Dec
1/n S&P500 1month ATM volatility at 22.3 implies ~1.4% daily move for the $SPX in the next month. That’s what statistics tells us for a sole time-series that is an index. But there’s more going on under the hood.
2/n ATM option vol mirrors investor expectations for volatility realized around the current level of the market. If you want a concrete estimate for future index volatility regardless of price levels, then it’s actually variance swaps you need. Enter, the $VIX index.
3/n Irrespective of its mainstream adopted alias as a volatility index, the $VIX is -for every practical purpose- the price of a 30day variance swap on the #S&P500. And it trades somewhat above the ATM volatility, to offset for skew and convexity.
Read 8 tweets
28 Jun 19
1/ Got been asked if Korean Autocallables is in top-5 issues when discussing vol, what would the other four be.
First and foremost, I would say you have to have your investing environment right, so here goes, by no particular order:
2/ Correlations between index constituents. $ICJ $JCJ. To make the point: First day in history when something like all but two shares in $SPX closed down, was Feb 5, 2018. Another two such days followed in December of same year.
3/ Volatility remains depressed by central bank policies. This is the elephant in the room. Watch $Fed Total Assets like a hawk.
Read 7 tweets

Did Thread Reader help you today?

Support us! We are indie developers!


This site is made by just two indie developers on a laptop doing marketing, support and development! Read more about the story.

Become a Premium Member ($3/month or $30/year) and get exclusive features!

Become Premium

Too expensive? Make a small donation by buying us coffee ($5) or help with server cost ($10)

Donate via Paypal

Or Donate anonymously using crypto!

Ethereum

0xfe58350B80634f60Fa6Dc149a72b4DFbc17D341E copy

Bitcoin

3ATGMxNzCUFzxpMCHL5sWSt4DVtS8UqXpi copy

Thank you for your support!

Follow Us on Twitter!

:(