Following up on my previous thread, which pondered what it takes to force the Fed's hand, this chart shows the 2015-18 tightening cycle in detail, and illustrates how much financial conditions have played a role in Fed policy. (THREAD)
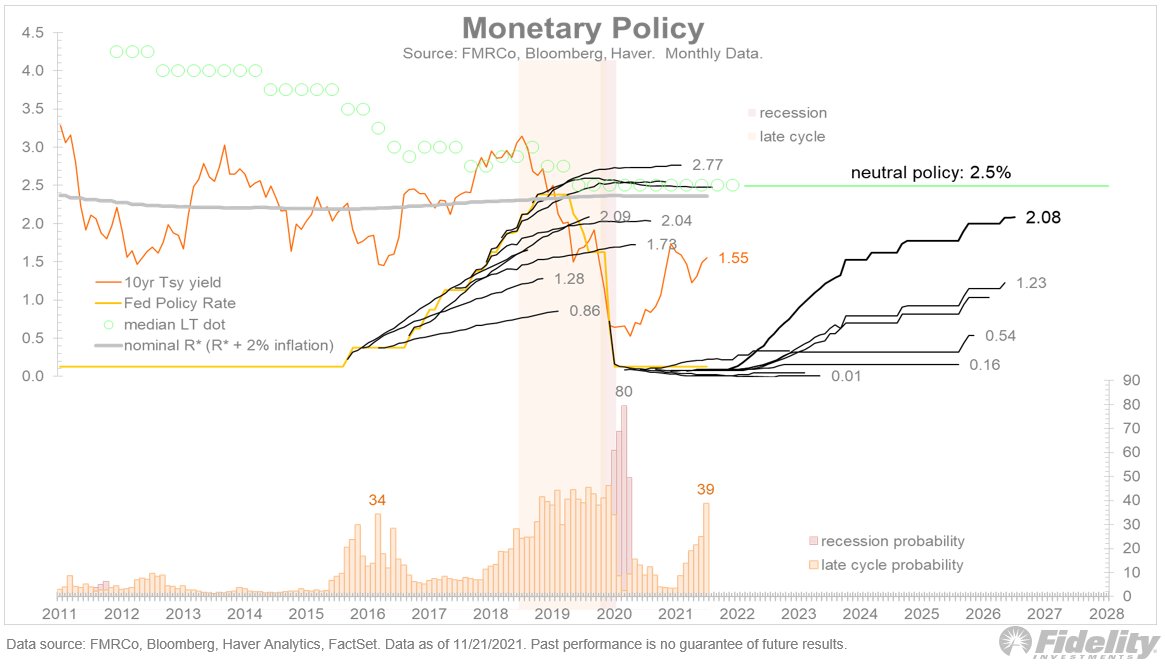
The top panel shows the official Goldman Sachs series overlaid on my constituent factors. The bottom panel shows the Fed Funds target rate and a series of forward curves taken at different points in time. /2
During the 2014-16 phase, the spike in financial conditions was driven mostly by credit spreads and the dollar (and eventually stocks). In December 2015 the Fed finally raised the Fed Funds rate for the first time since the Great Financial Crisis. /3
Within two weeks, financial conditions seized up as the dollar and high yield energy spreads soared. The S&P 500 had a drawdown of 15% in February 2016. This was enough to force the Fed’s hand and to put the tightening cycle on hold. /4
Then financial conditions improved dramatically, and this gave the Fed the conditions needed to resume its policy normalization a year later (December 2016). It was the great cycle-extender. /5
The Fed eventually took rates back up to neutral and even shrank its balance sheet in 2018. But by then financial conditions were tightening again, and the Fed pushed policy rates to above neutral. That was a bridge too far for the market. /6
The stock market’s sudden 20% drawdown drove financial conditions to more restrictive levels. Again the Fed pivoted, and by early 2019 it was cutting rates. /7
This history shows that a tightening of financial conditions can force the Fed to pivot, and it was the forward curve that provided the clue. Will it happen again? Possibly. But… /8
Even after last Friday’s rout, the FCI remains at an historically loose extreme. A lot will need to happen to the markets for financial conditions to seize up enough to change the Fed’s course. /END
• • •
Missing some Tweet in this thread? You can try to
force a refresh
What’s next for the Fed? The Chairman made plenty of news yesterday, but IMO it all comes down to financial conditions. The GS Financial Conditions index (GSUSFCI) is a real-time look into the financial economy, which tends to lead the real economy. (THREAD)
Financial conditions are at their all-time loosest. Perhaps this is why the Fed is hinting at speeding up the timeline. To me the bigger question is: What needs to happen for the FCI to tighten, and by how much, in order to cause the Fed to pivot back to a more dovish outlook? /2
The chart above shows that, in both 2016 and late 2018, a sharp tightening of financial conditions forced the Fed’s hand to either slow down the cycle or reverse it altogether. We are far away form that outcome, it seems. /3
Market volatility: Sharing a quick thread with some fast charts after yesterday’s market rout: First up, short-term breadth is very oversold, in line with previous 3-5% corrections… (THREAD)
…For the 50-day moving average, we are not quite as oversold./2
Momentum, measured as the percentage of stocks with an RSI < 30, is now oversold and also in line with past corrections. /3
The Fed is likely keeping an eye on financial conditions, as it did during the last cycle. They are a real-time look into the financial economy, which is more forward looking than the lagging indicators of the real economy (inflation & employment). (THREAD)
Here we see financial conditions for this cycle and the previous four periods of tightening financial conditions (measured from the low point in the Goldman Sachs Financial Conditions Index). /2
So far, financial conditions remain very loose, but the USD is up and credit spreads are slightly wider. /3
In some ways, the current Fed cycle reminds me of 2015-18. Take a look at this chart and I'll explain. (THREAD)
Back in late 2015, the Fed finally hiked rates for the first time. Back then there was a massive policy divergence between the US (which was normalizing) and the rest of the world (mainly Europe and China, which were spiraling down). /2
Just a few weeks after achieving lift-off, energy spreads blew out and the dollar soared, causing financial conditions to seize up. The Fed backed off, and this enabled the economy to ease back into mid-cycle. It was the great cycle extender. /3
How late are we in the current business cycle? The market and the Fed seem to have different opinions on that. (THREAD)
As the chart above shows, the market is on board with the Fed regarding its rate trajectory in 2022 and 2023, but is underpricing the Fed’s intended return all the way back to neutral (R-Star) in the out years. /2
The dot plot is at 2.5% as the terminal point and the market is at 2%. It’s not a huge difference, but it’s a difference. /3
What would a persistently looser-than-neutral Fed policy mean for equities? With the exception of the 1970s, equities are an effective inflation hedge and should do OK. What about the big growers though? Take a look at this chart, and I'll explain. (THREAD)
As the chart above shows (h/t to Kevin Muir of The Macro Tourist), the relative performance of large growth to small value has a clear inverse correlation to long-term interest rates. /2
If you believe that the rates market is underestimating the degree of Fed tightening in the coming years (and that long rates will rise accordingly), then you should probably not own too many long duration large-cap growth stocks. /3