According to Victoria Derbyshire and her followers if her brother hadn’t had 3 jabs he’d be hospitalised or worse. I’d love to see the evidence for this.
The typical replies
And her follow up
I should clarify: while her followers say that the triple jabbed like her brother who get Covid are actually being saved by the vaxx, Victoria didn’t say that. But I find her follow up strange
Actually I retract the clarification. Victoria is now explicitly claiming what I said she was:

• • •

Missing some Tweet in this thread? You can try to force a refresh
 

Keep Current with Prof Norman Fenton

Prof Norman Fenton Profile picture

Stay in touch and get notified when new unrolls are available from this author!

Read all threads

This Thread may be Removed Anytime!

PDF

Twitter may remove this content at anytime! Save it as PDF for later use!

Try unrolling a thread yourself!

how to unroll video
  1. Follow @ThreadReaderApp to mention us!

  2. From a Twitter thread mention us with a keyword "unroll"
@threadreaderapp unroll

Practice here first or read more on our help page!

More from @profnfenton

9 Dec
1. Here is the full lecture by David Healy which we hosted earlier this week. Extremely important (and concerning) information about the way vaccine safety is evaluated and presented.
2. Here is a transcript and the slides: davidhealy.org/where-does-the…
3. Here are David's thoughts on the event rxisk.org/the-handmaids-…
Read 4 tweets
25 Nov
1. YouTube has removed my video that showed why the Government claim that "1 in 3 people with the virus have no symptoms" was wrong. It had over 80,000 views. They say they will not allow content that 'spreads medical misinformation that contradicts local authorities or the WHO'.
2. But the medical misinformation was in the Govt claim - which wrongly equated a person 'having a positive PCR test result' with a person 'having the virus'. We only used data from the ONS and the Cambridge Univ study of asymptomatics
3. During the period we studied the Cambridge data, over 10,000 samples from asymptomatics were PCR tested. Only 43 were positive and of these 36 were found to be FALSE positives when subject confirmatory testing. So over 80% of asymptomatics testing positive were false
Read 7 tweets
14 Nov
1. New blog post with .@MartinNeil9: Is vaccine efficacy a statistical illusion? Turns out that, simply by delayed reporting of deaths by 1 week, it's inevitable a placebo will appear to reduce mortality in those who receive it compared to those who don't
probabilityandlaw.blogspot.com/2021/11/is-vac…
2. Here's the graph that results from a one week delay in reporting deaths in a simple example where both the 'vaxxed' and the 'unvaxxed' actually have the same constant mortality rate of 15 deaths per 100K people
3. And here's the graph from the latest ONS report on mortality by vaxx status. Compares non-covid mortality rates of vaxxed v unvaxxed. Notice the similarities with placebo example. Suggests it's a statistical illusion unexplainable by any real impact of vaxx on mortality rates
Read 5 tweets
4 Nov
1. Sorry I had to delete the important thread I just put up as I said "consistent underestimation of the proportion of the population vaccinated" when it should have been "consistent underestimation of the proportion of the population UNVACCINATED". Here is the correct version .
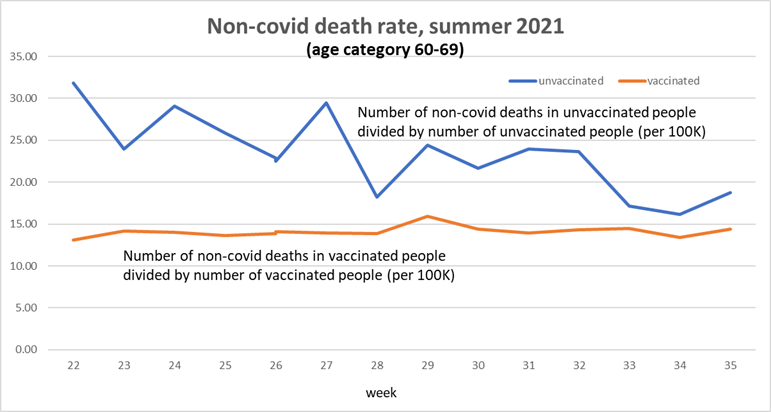
2. Our ongoing analysis of the ONS Nov 1 Deaths by Vacc Status Report is showing consistent underestimation of the proportion of the population unvaccinated. Example: Look at this plot of mortality rate for non-Covid deaths (age category 60-69) during the summer weeks...
3. The fact the mortality rates for vacced and unvacced are so different makes no sense. Assuming the vacc is doing no harm, these plots should be similar. Only reasonable possible explanation is that the proportion of the population unvaccinated is underestimated.
Read 6 tweets
2 Nov
1. As we requested, the ONS Nov 1 Deaths by Vacc Status Report now includes age categorised all-cause death numbers by vacc status. But, while it has data for age categories 60-69, 70-79 and 80+, there's only a single category of data for the age group 10-59.
2. In this ‘youngest’ age group all-cause mortality rate is currently around twice as high for those who've had at least one dose of vacc compared to unvacced. But as it includes such a wide age range it's still possible this extremely disturbing statistic is confounded by age
3. Where age categories are narrower, 60-69, 70-79 and 80+, age confounding effects are somewhat mitigated, and the data suggest there's lower all-cause mortality in vacced compared to unvacced in each of those age categories. BUT.....
Read 7 tweets
20 Oct
1/5. To calculate how unlikely it is to see the cluster of pulmonary haemorrhage deaths in new borns - as discussed in the thread by Scott Mclachlan - it's not enough just to consider the probability of it happening at a single hospital in 1 month ....
2/5. We have to consider the probability it will happen at at least one hospital somewhere in the UK in one month sometime during, say, a year. Explanation and calculation are in this (3-minute) video
3/5. If it was a cluster of 4 it would be unlikely in a single hospital (about 0.07%, i.e. 1 in 143 chance) but very likely (81% chance) of happening somewhere in a year. But what if we observe a cluster of 8 in the same hospital?
Read 5 tweets

Did Thread Reader help you today?

Support us! We are indie developers!


This site is made by just two indie developers on a laptop doing marketing, support and development! Read more about the story.

Become a Premium Member ($3/month or $30/year) and get exclusive features!

Become Premium

Too expensive? Make a small donation by buying us coffee ($5) or help with server cost ($10)

Donate via Paypal

Or Donate anonymously using crypto!

Ethereum

0xfe58350B80634f60Fa6Dc149a72b4DFbc17D341E copy

Bitcoin

3ATGMxNzCUFzxpMCHL5sWSt4DVtS8UqXpi copy

Thank you for your support!

Follow Us on Twitter!

:(