More on the turn in proportions testing positive in Gauteng (mentioned in last night's thread: ).
1. While we had suspected that the daily PTP had maxed out on 1 Dec, the clear periodicity in the data means that we had to wait to confirm
1b. We also had crashed into data problems of loaded data from public facilities, so had to split by public/private to be more certain that PTP in each had turned before calling it.
On top of that, the known issues with loading of Ag test results means focus must be on PCR tests.
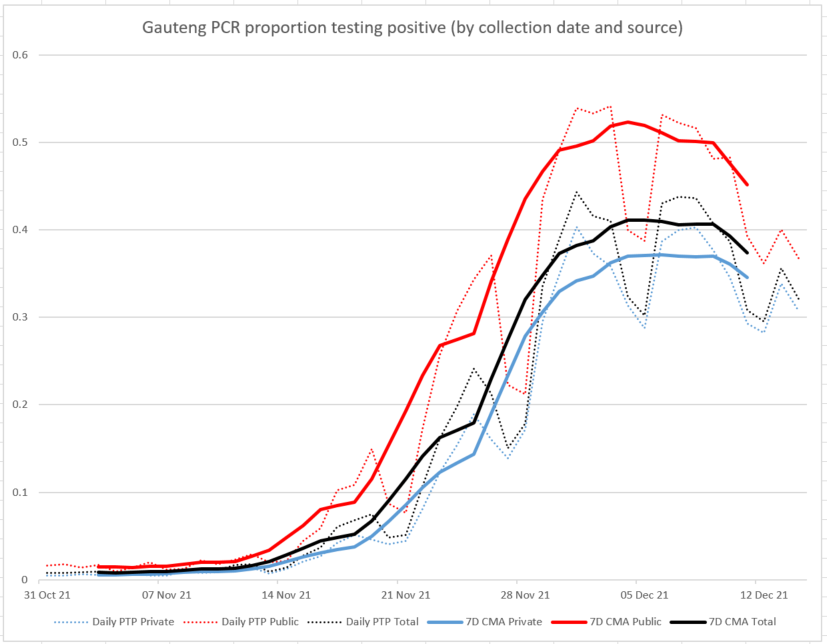
1c. Weekly periodicity means that it's preferable to use a 7day centred moving average, and to wait until the daily peaks had moved out of the 7DCMA window to confirm. Adding another day's data (covering to 14/12) confirms the trend. NB! GAUTENG PCR ONLY
1d. Data for 15/12 not yet incorporated as specimens collected yesterday still being loaded, while we know that most PCR test results are loaded within 24 hours.
2. As noted previously, it is also essential to look at data by collection date (and preferably PTP by collection date, to get rid of volume effects), and not by the date of reporting. This graph shows why:
NB GAUTENG ONLY
NB GAUTENG ONLY
RHscale
Black line: 7-day centred moving average of PCR PTP.
Grey line: daily PCR PTP (by date of collection)

LHscale
Blue line: daily PCR cases (date of collection)
Red dotted line: daily ALL cases (as reported nightly)
Red line: 7-day CMA ALL cases (reported)
NB GAUTENG ONLY, and the *reported* (red) data includes Antigen AND PCR tests. The other data are PCT only

The red line (7DCMA ALL cases, reported) peaks on 11/12, a full week after PTP (7DCMA, collected) peaked on 4/12. Daily PTP (collected) peaked on 1 December ...
NB GAUTENG ONLY
the reported (both PCR and Ag) cases peaked only (possibly!) on 12 December (partly due to to the IT problems last week and delays in loading Ag cases)
Point being: Followers of South African Covid data should be careful of reading too much into analyses based solely on the nightly reported data. Yes, the patterns are broadly similar; the subtle differences can be marked.

• • •

Missing some Tweet in this thread? You can try to force a refresh
 

Keep Current with Tom Moultrie

Tom Moultrie Profile picture

Stay in touch and get notified when new unrolls are available from this author!

Read all threads

This Thread may be Removed Anytime!

PDF

Twitter may remove this content at anytime! Save it as PDF for later use!

Try unrolling a thread yourself!

how to unroll video
  1. Follow @ThreadReaderApp to mention us!

  2. From a Twitter thread mention us with a keyword "unroll"
@threadreaderapp unroll

Practice here first or read more on our help page!

More from @tomtom_m

15 Dec
Latest @MRCza and @UCT_news report on excess deaths in South Africa released, covering the period to 11Dec2021. A total of 277 700 excess natural deaths since 3May20. Full report available here: samrc.ac.za/reports/report…
(2/) 1 887 excess natural deaths in the week to 11Dec, up from 1 726 in the preceding week. The p-score this week is 23%, up slightly from 21% the previous week.
(3/) Still no strong excess natural mortality signal from Gauteng or its metros. The p-score in Gauteng in the most recent week is 19% (the fourth lowest of the 9 provinces). Highest in the Eastern Cape (45%) and Mpumalanga (25%).
Read 21 tweets
12 Dec
Given the comedic misinterpretation of the South African testing data offered by @BallouxFrancois (and many others!) last night ... I offer some tips having contributed to the analysis of the testing data for the @nicd_sa since April last year. (1/6)
1. The daily tests announced are those that are LOADED that day. The test may have been conducted several days/weeks earlier. What those daily reports mean is pretty hard to interpret. (2/6)
2. The VOLUME of daily tests is highly periodic, low on weekends, for example. The count of CASES is also highly periodic. But the proportion testing positive is ALSO periodic - so it's not a case of the two periodicities in cases and tests cancelling each other out. (3/6)
Read 6 tweets
8 Dec
Latest @MRCza and @UCT_news report on excess deaths in South Africa released, covering the week to 4Dec21. 276 000 excess natural deaths since 3May20. 191k in 2021. Report here: samrc.ac.za/reports/report…
There is no clear signal yet of W4 mortality yet in the provinces and metros with the highest numbers of cases to date.
Measured by the p-score, excess natural deaths increased slightly to 25% this week (just over 2000 deaths), highest in Eastern Cape (46%), lowest in Northern Cape (9.4%).
Read 8 tweets
1 Dec
Latest @MRC and @UCT_news report on excess mortality in South Africa released, covering the period through 27Nov21. 273k estimated excess natural deaths since 3May2020, 647 in the last week. Report here: samrc.ac.za/reports/report…
At present, no sign of increased natural mortality in South Africa, Gauteng, or indeed Tshwane metro.
p-scores for natural deaths are at interwave lows (8.3% nationally, ranging from -4.5% in Gauteng to 39% in the Northern Cape.
By age, p-scores fell in all age-groups other than 5-19. Deaths are few in this age band, so the p-score inherently unstable. #NotToBeOverInterpreted
Read 13 tweets
29 Nov
On developed country privilege, and the marginalisation of the global South in much of what passes as Covid public science: a view from the South. A thread. 1/20
I do not intend to engage on the topic of the disproportionate and hypocritical treatment meted out by countries of the North to Southern Africa and Southern Africans stemming from the identification of the omicron variant. 2/20
I, and many others far more erudite than I, have already expressed those views (see, for example @tuliodna @_HassanF; @gregggonsalves; @GYamey) 3/20
Read 21 tweets
28 Jul
Latest @MRCza and @UCT_news report out on excess deaths, covering the period to 24 July 2021. 10 500 excess deaths in the week to 24 July 2021, bringing the total excess natural deaths since 3 May 2020 to 214 000. 130 000 of those in 2021. Report here: samrc.ac.za/reports/report…
20 000 natural deaths this week, still below the peak of 24 000 at the top of wave 2. Complex pattern may emerge in the next few weeks as Gauteng and its metros decrease, while other provinces (and metros) increase.
Nationally, natural deaths this week 119% of expected. Gauteng 181% (down from 210% last week). P-scores in other provinces increasing: NW (165%); LP (157%); MP (138%). Big increase in KZN to 100% (2x expected deaths), up from 51% last week.
Read 5 tweets

Did Thread Reader help you today?

Support us! We are indie developers!


This site is made by just two indie developers on a laptop doing marketing, support and development! Read more about the story.

Become a Premium Member ($3/month or $30/year) and get exclusive features!

Become Premium

Too expensive? Make a small donation by buying us coffee ($5) or help with server cost ($10)

Donate via Paypal

Or Donate anonymously using crypto!

Ethereum

0xfe58350B80634f60Fa6Dc149a72b4DFbc17D341E copy

Bitcoin

3ATGMxNzCUFzxpMCHL5sWSt4DVtS8UqXpi copy

Thank you for your support!

Follow Us on Twitter!

:(