Hi all,

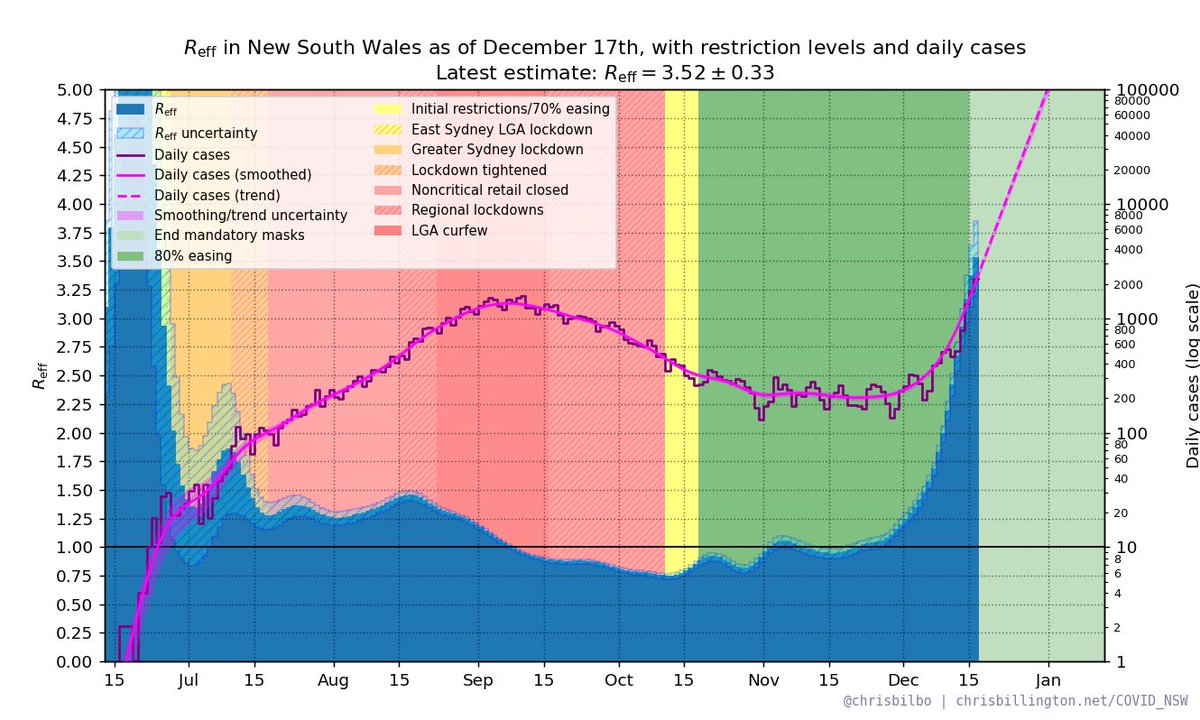
You might have noticed my short-term projections for the NSW outbreak yesterday were pretty nuts. It turns out this projection was unrealistic, due to some approximations in my code that are no longer valid now that growth rates are higher. 1/🧵
So first, apologies. These issues are fixed now and today's projection ought to be more realistic. Secondly, gory details below. There were two problems. 2/🧵
Problem 1. smoothing. Many have noticed my "smoothed cases" line didn't actually go through the middle of the data. This is not incorrect per se, this is what correct smoothing with a symmetric smoothing window looks like when the data has a nonzero second derivative. 3/🧵
What's incorrect is to use that "smoothed cases" line to estimate of the current caseload. Because the smoothing was in a sense bringing some of the influence of future large caseloads to the present, this made the starting point for projections a few days ahead of reality 4/🧵
I'm now doing the smoothing in log space. Taking the log of case numbers, smoothing, then exponentiating again. Exponentials have no second derivative in log space, so the problem goes away. 5/🧵
This kind of smoothing doesn't preserve the total case numbers, which is unappealing, but seems like the better compromise to make. 6/🧵
Problem 2: generation distributions. I estimate R_eff as the 5-day growth factor in new cases. This approximates that everyone transmits after exactly 5 days, when in reality, that's just an average. That itself wouldn't be too bad, this is probably an OK estimate of R_eff. 7/🧵
The problem is that the short-term projection comes not from merely extrapolating that same growth rate, but from feeding it to an SIR model. In (simple) SIR models, transmissions are exponentially distributed in time. 8/🧵
Exponential distributions have more probability at shorter times. Transmissions that occur earlier have more time to go on to transmit again, such that an SIR model given an R_eff of 3 and 5-day mean generation time will result in a 5-day growth factor *larger* than 3.
9/🧵
This didn't matter when R_eff was closer to 1.0, but is now a massive error. Feeding R_eff = 3 to an SIR model with transmissions exponentially distributed would have resulted in a 5-day growth factor of 7.
10/🧵
This is likely why the projection was blowing up to 30k cases in only a week. That's not realistic at all for the timescale of a week. 11/🧵
I've resolved this by converting R_eff before feeding it to the SIR model, such that the result has the same 5-day growth factor. The formula is simple: R' = 1 + log(R), where R' is what I'm feeding to the SIR model and R is what's obtained from the 5-day growth rate 12/🧵
I got this conversion formula from the following paper that discusses these distinctions: ncbi.nlm.nih.gov/pmc/articles/P…
13/🧵
I also only twigged this issue was a possibility because someone on twitter pointed it out months ago. I don't remember who they were, but thanks and hello if you're reading! I didn't fix it at the time because it didn't matter unless R was large, and who expected that? 14/🧵
With these two issues resolved the short-term projection is more realistic:

day cases 68% range
Fri: 1873 1557—2209
Sat: 2283 1878—2727
Sun: 2789 2266—3368
Mon: 3401 2727—4158
Tue: 4141 3286—5137
Wed: 5032 3932—6329
Thu: 6117 4716—7788

15/🧵
Apologies again for putting out dodgy numbers, and appreciate the feedback that helps find issues like these. Please share the fact that this was wrong with anyone you hear quoting the stupid numbers I put out yesterday. 16/16.

• • •

Missing some Tweet in this thread? You can try to force a refresh
 

Keep Current with Chris Billington

Chris Billington Profile picture

Stay in touch and get notified when new unrolls are available from this author!

Read all threads

This Thread may be Removed Anytime!

PDF

Twitter may remove this content at anytime! Save it as PDF for later use!

Try unrolling a thread yourself!

how to unroll video
  1. Follow @ThreadReaderApp to mention us!

  2. From a Twitter thread mention us with a keyword "unroll"
@threadreaderapp unroll

Practice here first or read more on our help page!

More from @Chrisbilbo

18 Dec
Figured out why my Hunter region R_eff calculation had zero uncertainty. I was literally clipping R_eff values to the "sane" assumption that it would be less than 10 in the uncertainty calculation. Some other clipping for the sake of "sanity" was also limiting the central value.
What used to be insane now isn't. Here's what the Hunter looks like with none of this clipping. Image
The clipping was there for a reason, sometimes small numbers and bad luck does produce stupid R_eff estimates. My code might now say stupid things in those contexts instead. But won't have to worry about that until numbers are smaller.
Read 4 tweets
17 Dec
They're the experts, but I think ATAGI is making the wrong call. There is a persistent bias in health regulation toward inaction in uncertain times, as if regulators are somehow less responsible for the consequences of inaction than of action. 1/🧵
Much in the article emphasises uncertainty. But we need to make judgement call with the information available. Just because of uncertainty doesn't mean the best option is doing nothing. There's no reason to privilege that course of action over any other. 2/🧵
Just as there are considerable uncertainties about the negative consequences of bringing forward vaccines, there are considerable uncertainties about the negative consequences of not doing so as well. 3/🧵
Read 4 tweets
17 Dec
NSW R_eff as of December 18th with daily cases and restrictions. Latest estimate: R_eff = 3.35 ± 0.25

Cases shown on both a linear scale (first image) and log scale (second image).

More info chrisbillington.net/COVID_NSW.html

#covid19nsw #covidsydney ImageImage
R_eff in Greater Sydney vs rest of New South Wales:

Greater Sydney: R_eff = 2.37 ± 0.27
NSW excluding Greater Sydney: R_eff = 8.55 ± 0.78

(Cases shown on a log scale)

(note region-specific data is several days old, does not include today's cases)

#covid19nsw #covidsydney ImageImage
R_eff in LGAs of concern* vs the rest of NSW (*all of Penrith included):

LGAs of concern: R_eff = 1.92 ± 0.22
Rest of NSW: R_eff = 5.57 ± 0.50

(Cases shown on a log scale)

(note LGA data is several days old, does not include today's cases)

#covid19nsw #covidsydney ImageImage
Read 7 tweets
16 Dec
NSW R_eff as of December 17th with daily cases and restrictions. Latest estimate: R_eff = 3.52 ± 0.33

Cases shown on both a linear scale (first image) and log scale (second image).

More info chrisbillington.net/COVID_NSW.html

#covid19nsw #covidsydney
R_eff in Greater Sydney vs rest of New South Wales:

Greater Sydney: R_eff = 1.76 ± 0.17
NSW excluding Greater Sydney: R_eff = 7.22 ± 1.01

(Cases shown on a log scale)

(note region-specific data is several days old, does not include today's cases)

#covid19nsw #covidsydney
R_eff in LGAs of concern* vs the rest of NSW (*all of Penrith included):

LGAs of concern: R_eff = 1.51 ± 0.15
Rest of NSW: R_eff = 4.16 ± 0.56

(Cases shown on a log scale)

(note LGA data is several days old, does not include today's cases)

#covid19nsw #covidsydney
Read 7 tweets
15 Dec
NSW R_eff as of December 16th with daily cases and restrictions. Latest estimate: R_eff = 3.24 ± 0.63

Cases shown on both a linear scale (first image) and log scale (second image).

More info chrisbillington.net/COVID_NSW.html

#covid19nsw #covidsydney ImageImage
R_eff in Greater Sydney vs rest of New South Wales:

Greater Sydney: R_eff = 1.45 ± 0.13
NSW excluding Greater Sydney: R_eff = 1.81 ± 0.32

(Cases shown on a log scale)

(note region-specific data is several days old, does not include today's cases)

#covid19nsw #covidsydney ImageImage
R_eff in LGAs of concern* vs the rest of NSW (*all of Penrith included):

LGAs of concern: R_eff = 1.38 ± 0.14
Rest of NSW: R_eff = 1.65 ± 0.17

(Cases shown on a log scale)

(note LGA data is several days old, does not include today's cases)

#covid19nsw #covidsydney ImageImage
Read 6 tweets
1 Oct
VIC R_eff as of October 2nd with daily cases and restrictions. Latest estimate: R_eff = 1.53 ± 0.09

Plus projected effect of vaccination rollout.

Cases shown on a linear scale (log scale in next tweet).

More info chrisbillington.net/COVID_VIC_2021…

#COVID19Vic
VIC R_eff as of October 2nd with daily cases and restrictions. Latest estimate: R_eff = 1.53 ± 0.09

Plus projected effect of vaccination rollout.

(Cases shown on a log scale)

More info chrisbillington.net/COVID_VIC_2021…

#COVID19Vic
Expected numbers if the current trend continues:

day cases 68% range
Sun: 1591 1327—1863
Mon: 1739 1409—2100
Tue: 1896 1485—2367
Wed: 2068 1558—2644
Thu: 2246 1635—2952
Fri: 2433 1706—3288
Sat: 2631 1770—3655

Doubling time is 8.2 days.

#COVID19Vic
Read 7 tweets

Did Thread Reader help you today?

Support us! We are indie developers!


This site is made by just two indie developers on a laptop doing marketing, support and development! Read more about the story.

Become a Premium Member ($3/month or $30/year) and get exclusive features!

Become Premium

Too expensive? Make a small donation by buying us coffee ($5) or help with server cost ($10)

Donate via Paypal

Or Donate anonymously using crypto!

Ethereum

0xfe58350B80634f60Fa6Dc149a72b4DFbc17D341E copy

Bitcoin

3ATGMxNzCUFzxpMCHL5sWSt4DVtS8UqXpi copy

Thank you for your support!

Follow Us on Twitter!

:(