
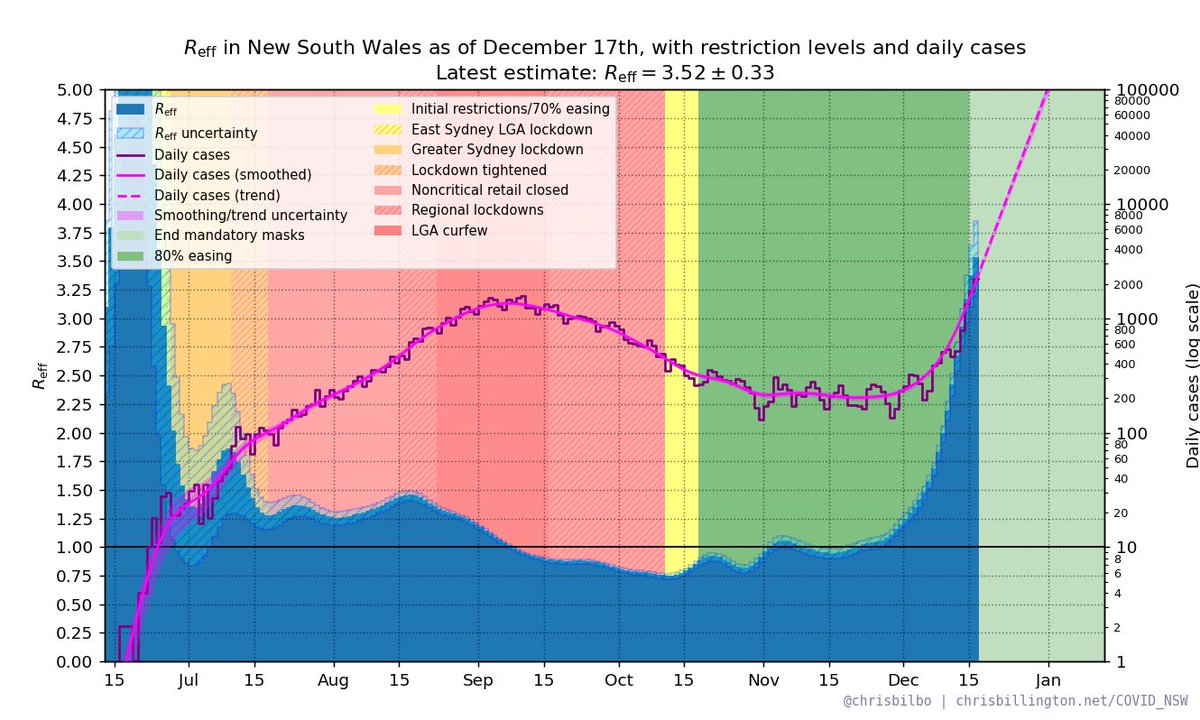
NSW R_eff as of December 17th with daily cases and restrictions. Latest estimate: R_eff = 3.52 ± 0.33
Cases shown on both a linear scale (first image) and log scale (second image).
More info chrisbillington.net/COVID_NSW.html
#covid19nsw #covidsydney
Cases shown on both a linear scale (first image) and log scale (second image).
More info chrisbillington.net/COVID_NSW.html
#covid19nsw #covidsydney

R_eff in Greater Sydney vs rest of New South Wales:
Greater Sydney: R_eff = 1.76 ± 0.17
NSW excluding Greater Sydney: R_eff = 7.22 ± 1.01
(Cases shown on a log scale)
(note region-specific data is several days old, does not include today's cases)
#covid19nsw #covidsydney
Greater Sydney: R_eff = 1.76 ± 0.17
NSW excluding Greater Sydney: R_eff = 7.22 ± 1.01
(Cases shown on a log scale)
(note region-specific data is several days old, does not include today's cases)
#covid19nsw #covidsydney


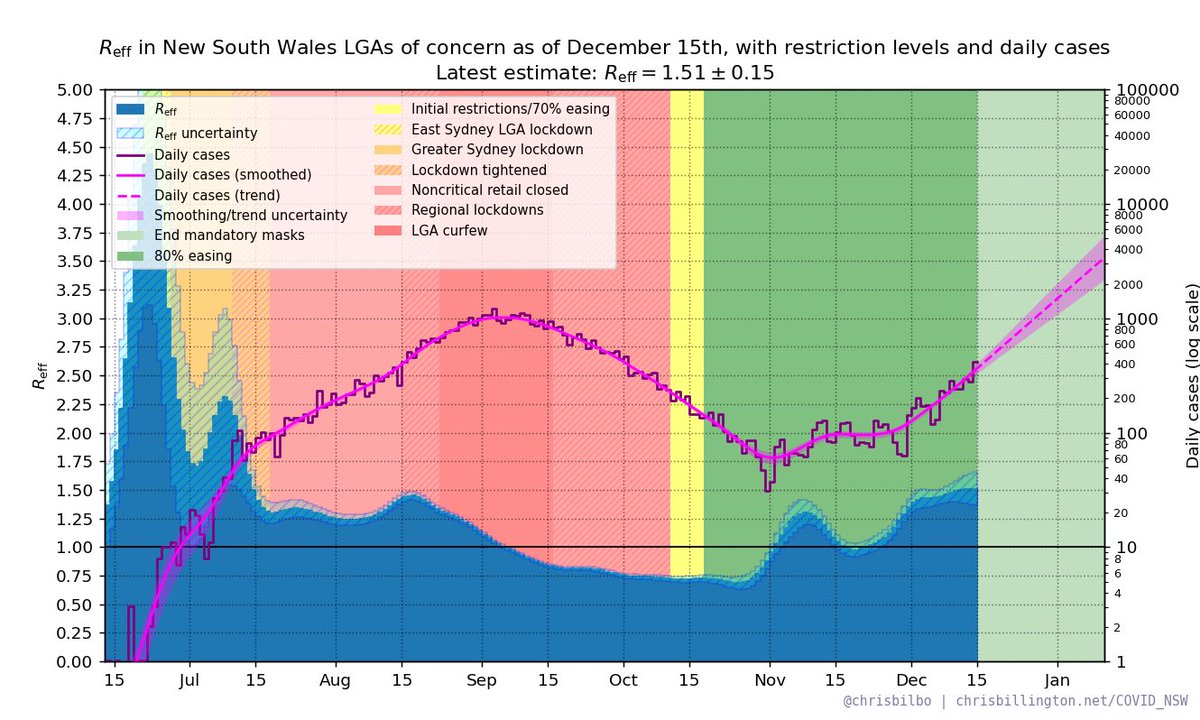
R_eff in LGAs of concern* vs the rest of NSW (*all of Penrith included):
LGAs of concern: R_eff = 1.51 ± 0.15
Rest of NSW: R_eff = 4.16 ± 0.56
(Cases shown on a log scale)
(note LGA data is several days old, does not include today's cases)
#covid19nsw #covidsydney
LGAs of concern: R_eff = 1.51 ± 0.15
Rest of NSW: R_eff = 4.16 ± 0.56
(Cases shown on a log scale)
(note LGA data is several days old, does not include today's cases)
#covid19nsw #covidsydney

The Hunter region: R_eff = 15.12 ± 0.22
Illawarra region: R_eff = 2.22 ± 0.99
Western New South Wales: R_eff = 2.70 ± 2.33
(Cases shown on a log scale)
(note region-specific data is several days old, does not include today's cases)
#covid19nsw #covidsydney
Illawarra region: R_eff = 2.22 ± 0.99
Western New South Wales: R_eff = 2.70 ± 2.33
(Cases shown on a log scale)
(note region-specific data is several days old, does not include today's cases)
#covid19nsw #covidsydney


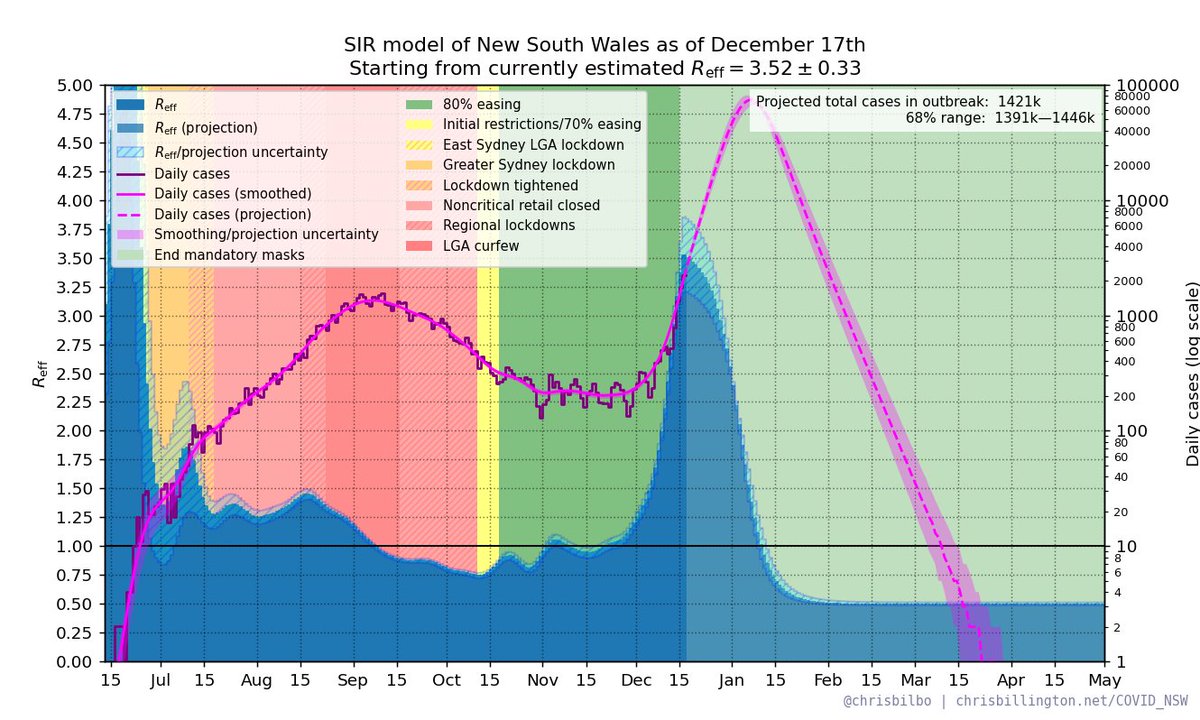
Expected numbers if the current trend continues:
day cases 68% range
Sat: 2644 2284—3020
Sun: 3296 2830—3795
Mon: 4109 3499—4771
Tue: 5108 4316—5993
Wed: 6351 5316—7511
Thu: 7865 6520—9402
Fri: 9717 7986—11726
Doubling time is 2.8 days.
day cases 68% range
Sat: 2644 2284—3020
Sun: 3296 2830—3795
Mon: 4109 3499—4771
Tue: 5108 4316—5993
Wed: 6351 5316—7511
Thu: 7865 6520—9402
Fri: 9717 7986—11726
Doubling time is 2.8 days.
For those who haven't seen it, please note the following thread on why yesterday's projections were unrealistic:
https://twitter.com/Chrisbilbo/status/1471598943213522946
Also note the above trendlines are simple exponential extrapolations. In reality even if nothing is done, the curve will bend once most people have been infected. Hard to know when this will happen, but a simple SIR model that assumes we detect 20% of infections looks like this:
• • •
Missing some Tweet in this thread? You can try to
force a refresh


