A series of mini-thoughts for a Sunday afternoon. South Africa vs. Rest of the World - the Omicron Edition.
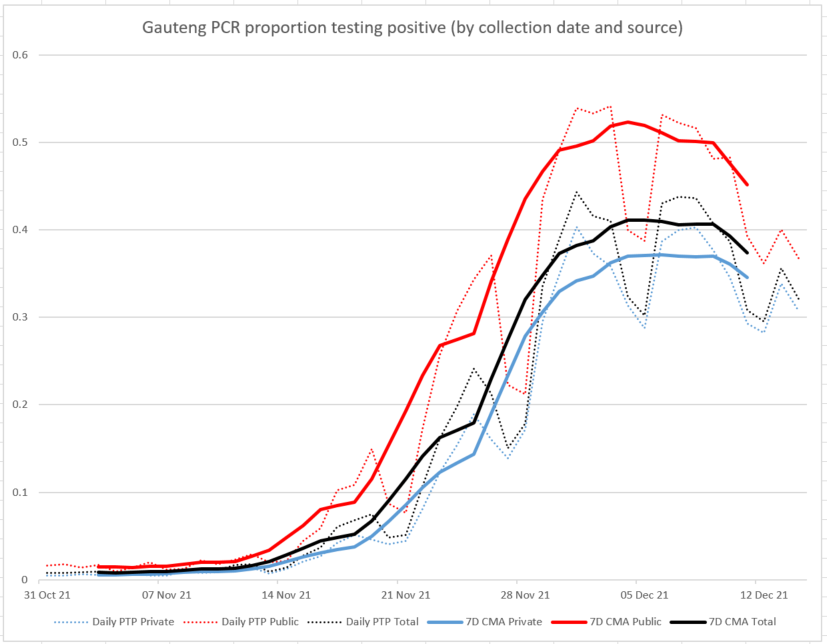
1) We are pretty confident that Gauteng, the province at the South African Omicron epicentre is past its peak in terms of proportion of tests returning positive.
1) We are pretty confident that Gauteng, the province at the South African Omicron epicentre is past its peak in terms of proportion of tests returning positive.
2) Despite massive number of cases (and incredibly high PTP: in the week to 11Dec, in Gauteng an ALL-TIME high of 38.7% - and an intra-week daily high of 41% when looking at PCR tests only), we have seen relatively few hospitalisations and deaths.
3) It really *does seem* as if South Africa, my country, will escape relatively unscathed in this wave.
None of that is particularly new. But other things gnaw at me.
None of that is particularly new. But other things gnaw at me.
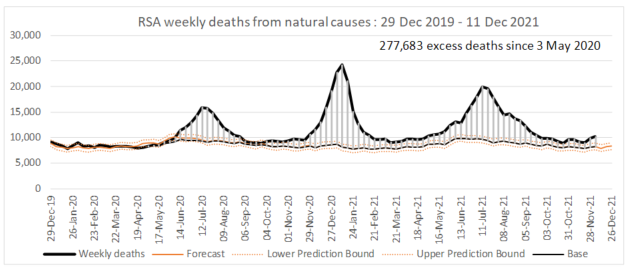
4) Excess natural deaths as of 11 Dec were 278 000 as per our weekly @MRCza report.
samrc.ac.za/reports/report…
We have also been of the view that between 85 and 95% of these ED, over the entire course of the epidemic, are related to Covid (genus.springeropen.com/articles/10.11…)
samrc.ac.za/reports/report…
We have also been of the view that between 85 and 95% of these ED, over the entire course of the epidemic, are related to Covid (genus.springeropen.com/articles/10.11…)
5) So that means, perhaps 250 000 Covid deaths since Autumn 2020. (cf: the official number of barely 90 000). Expressed per million, that is an 'unofficial Covid deaths' of around 4 200.
6) From Worldometer (yes, I *know* - I am pulling approximates here), the UK is around 2 150 -- roughly HALF the unofficial SA number
7) I am struck by this comparison from OWID. Their SA data are ours (but all-cause not natural-only).
And we can see towards of the beta wave, excess deaths in the two countries were of a kind.
And we can see towards of the beta wave, excess deaths in the two countries were of a kind.

8) But the UK had begun to vaccinate extensively by then. Our programme only got going in July, by which time Delta was on us.
9) SO. WHAT IF ... South Africa's 'light escape' (in the context of a QUARTER OF A MILLION excess natural deaths) is _in no small measure because_ we 'bought' that present at horrendous cost during past waves.
10) No, I do not have the answers. Yes, I am deeply grateful by what we are seeing here. But, I am appalled by how the South African Experience (TM) is being used to weaponise against unfolding events in other countries ("don't intervene, it's a nothingburger" says my bete noire)
11) Until we have a better sense of the issues raised here (esp in #9), premature celebration is uncalled for outside of SA; and in SA, perhaps we should spare a thought for the families of 250 000 of our fellow citizens whose loved ones will not be joining them for Christmas.
11) Careful data analysis, and a deep appreciation of local knowledge and specificities, coupled with global action (as argued with @GYamey and @BillHanage last week: time.com/6128506/omicro…) may yet get us through this.
• • •
Missing some Tweet in this thread? You can try to
force a refresh