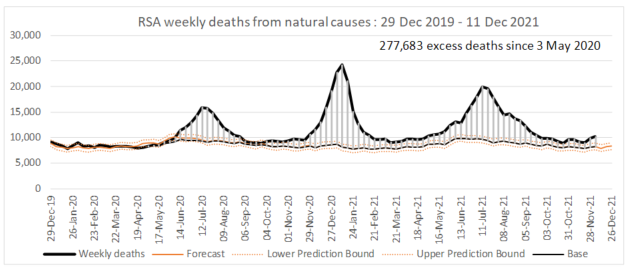
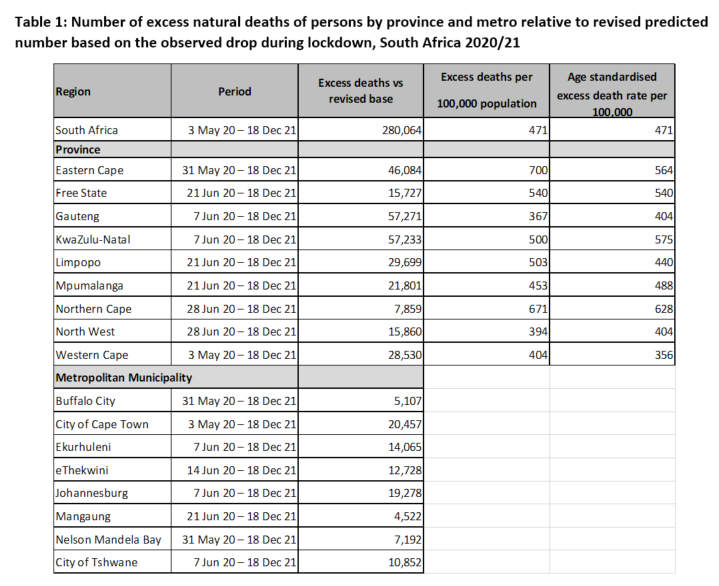
Latest @MRCza and @UCT_news report on excess deaths in South Africa released, covering the period to 18Dec21. 280 000 excess natural deaths (471/100 000) since 3May2020.
Report available here: samrc.ac.za/reports/report…
Report available here: samrc.ac.za/reports/report…
2/ Nationally, natural deaths were 33% above expected (the p-score), compared to 18% the previous week. 2 600 excess natural deaths in the most recent week (12-18Dec), up from 1500 the previous week.
70% of excess deaths were among those aged 60+.
70% of excess deaths were among those aged 60+.

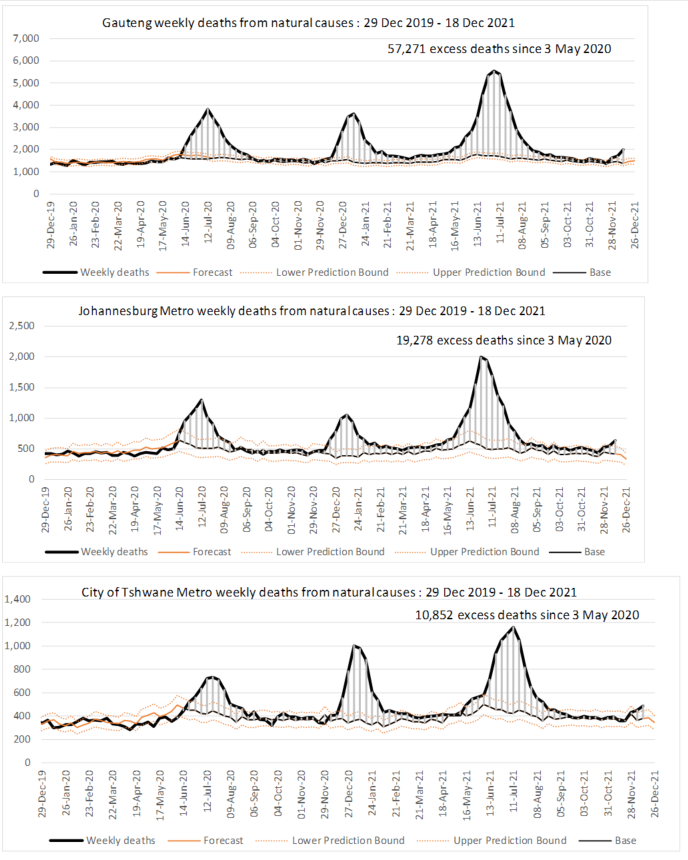
3/ By province, excess deaths increased in Gauteng over the week (p-score up from 16 to 44%). Limpopo up from 19% to 47%. Deaths in Johannesburg was 53% above expected (last week 27%). But still FAR below the peaks in previous waves


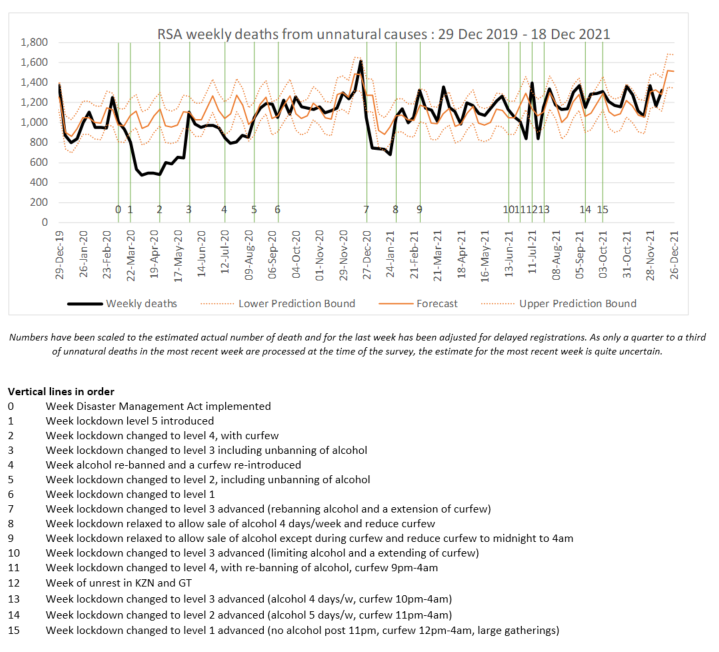
4/ Unnatural deaths follow the expected weekly pattern very closely.
5/ I recorded earlier this week that the official death numbers are both laggy and complete. The figure below shows the reported deaths (by reporting date) and excess natural deaths (by occurrence).

6/ The differential quality of reporting in a devolved healthcare system is evident. While the Western Cape reporting captures most of the quantity of the excess deaths and is consistent with the temporal pattern, other provinces do not do as well (e.g. Mpumalanga).
7/ With such differences in reporting within a single country (where we have an idea of a counterfactual), the potential scale of under-reporting in many other sub-Saharan African countries becomes apparent.
/8 The @nicd_sa testing report has yet to be released ... will append comments to this thread when it is. But in the meantime
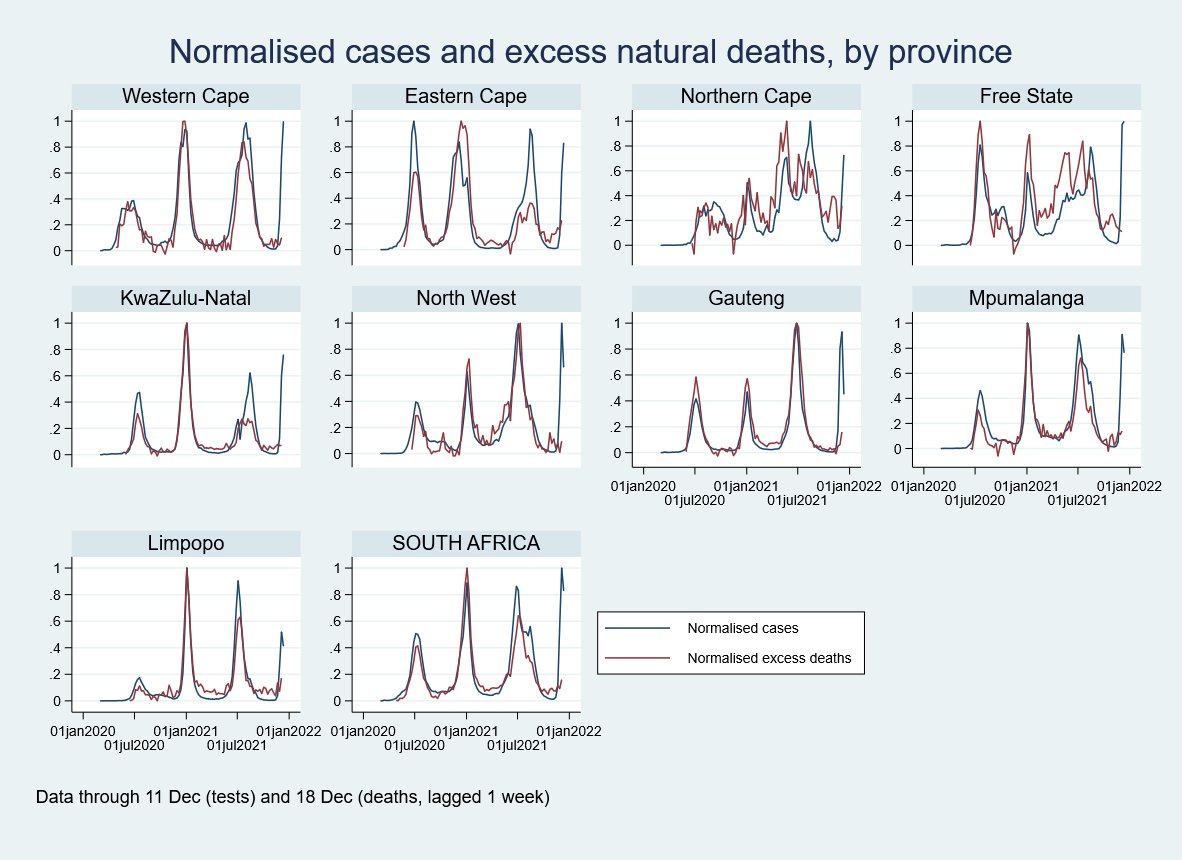
9/ Combining the data from testing and excess deaths. The pattern previously described persists, with a substantial decoupling of deaths from cases: the figure below shows the cases and (lagged) excess deaths normalised to their historical peaks

10/ The same data, looked at differently: lagged p-score plotted against PTP, by wave. (Definitions of when a wave ends and the next begins are somewhat arbitary; here based on when National PTP turns upwards –for W4, on 7Nov21).

11/ This also shows much lower excess natural mortality for a given PTP across the board (red dots).
12/ So again – overwhelmingly positive news. It really does look like this wave will not be as bad as previous ones. Here’s hoping this is true in other parts of the world too. In the meantime, stay safe, be safe, vaccinate.
13/ lastly (for now, until comments on the testing data are added): the next report on excess deaths is scheduled for 5 Jan 2022.
14/ At last! The @NICD_sa has released its weekly testing report, covering testing through 18Dec21. Proportion testing positive (PTP), nationally, increased from 35.7% to 36.7%, but fell sharply in Gauteng (from 28.6% to 29.1%).nicd.ac.za/diseases-a-z-i…


15/ Provincial PTP exceeded 40% in 7 provinces. By age, PTP highest among those aged 10-19, but PTP exceeded 30% in every age group other than those under 5. PTP increased in each age group other than those aged 10-39, where small declines were observed.


16/ 195 of 262 districtis in the country showed a PTP greater than 30% in the week to 18Dec21

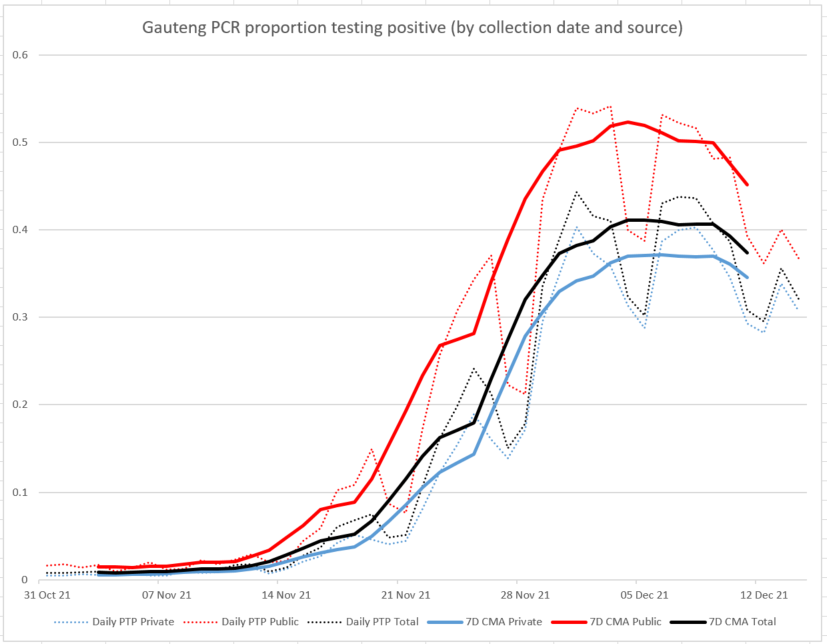
17/ For Gauteng (daily data; PCR only) - cases are falling faster than PTP as testing volumes fall. (Thus: looking at trends in cases exaggerates the pace of decline, although evidently a decline has been under way for some time now on either metric)

18/ Nationally (PCR tests only), the 7day centred moving average is falling consistently. The national pattern APPEARS to have stalled at a high peak, but that is a compositional effect of PTP falling in the northern provinces, rising in the coastal provinces ...

19 (end)/ ... and changing volumes by province over time.
That said, it feels very odd to be celebrating the decline in PTP in Gauteng. In recent days, it's STILL around 20-25%. It has a LONG way to fall before this wave is over.
That said, it feels very odd to be celebrating the decline in PTP in Gauteng. In recent days, it's STILL around 20-25%. It has a LONG way to fall before this wave is over.
@nicd_sa Aaargh! *38.6%**.
Addition to thread reflecting release of NICD testing report...
https://twitter.com/tomtom_m/status/1473984936180858882
• • •
Missing some Tweet in this thread? You can try to
force a refresh