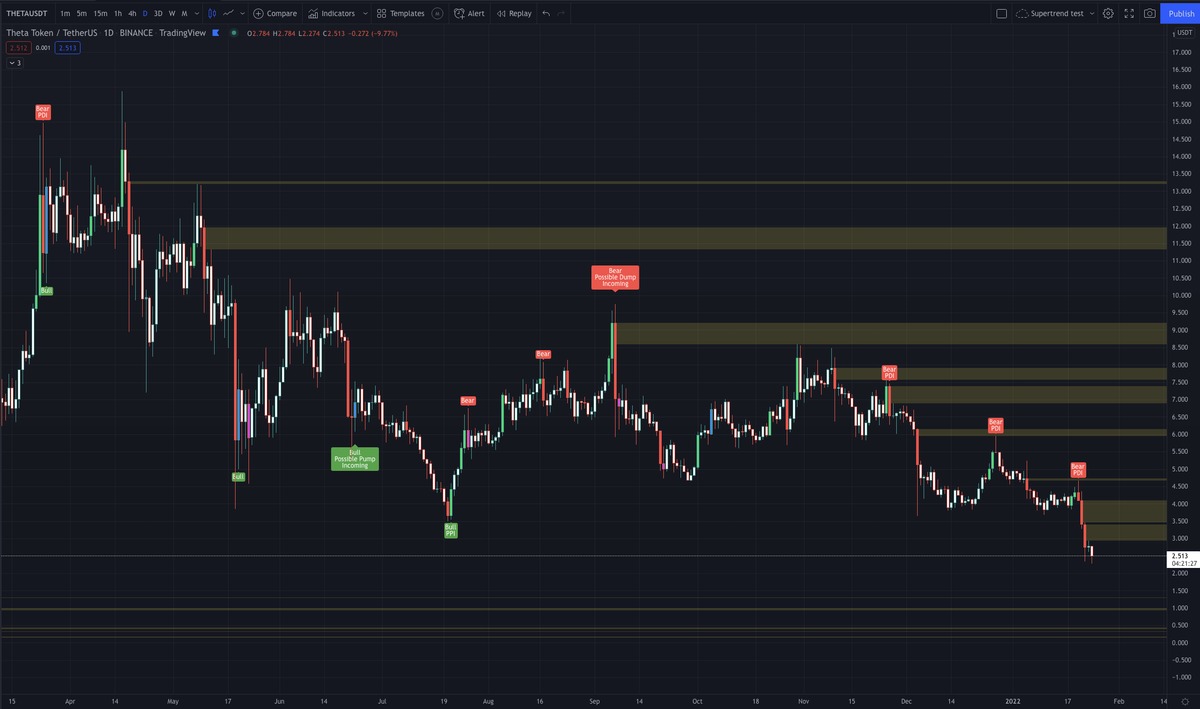
1/ As it stands: We're still in this range. Now at range low. Over the past few days we've seen aggressive pushing down with absolutely no relief. However, we're literally at the bottom of this range so i'm not looking for shorts at the moment. $Btc #Bitcoin 

2/ Moving to the high tf we see a red vector on the daily, and 2 pinks vectors on the 12hr. The last 12hr being pink and not pushing down beyond the lows makes me think they're just building long positions and by aggressively dropping price are trying to scare retail into selling


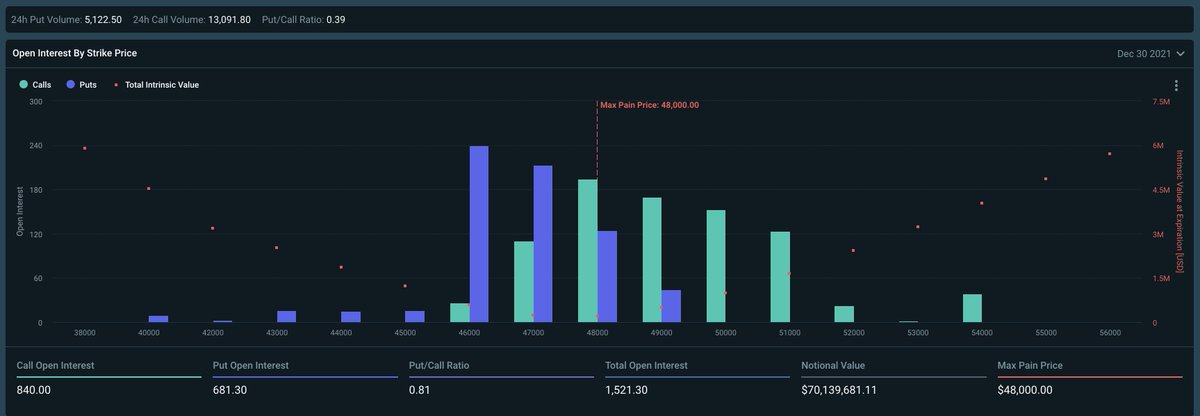
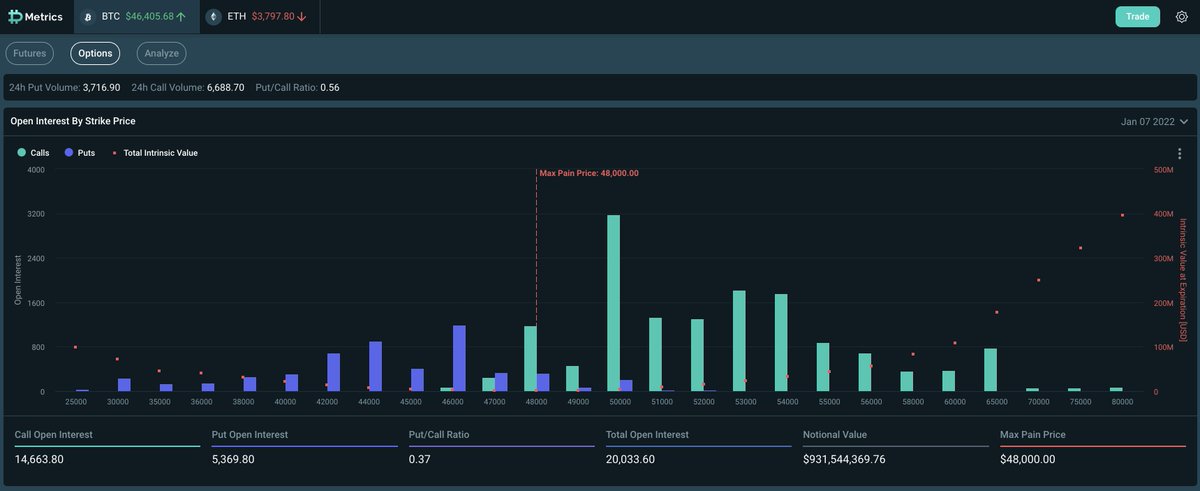
3/ Max pain for options expiry for 30th Dec (ie today) is 48k (image 1). And with it being Thursday i'm always looking for a reversal in the New York session.
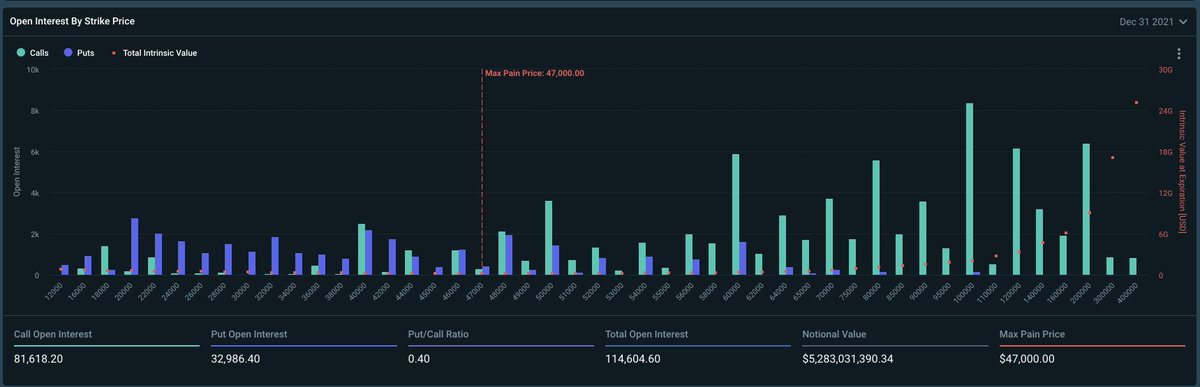
Max pain for 31st of Dec is 47k (image 2). Then we have a clean slate to work with for 2022.
Max pain for 31st of Dec is 47k (image 2). Then we have a clean slate to work with for 2022.
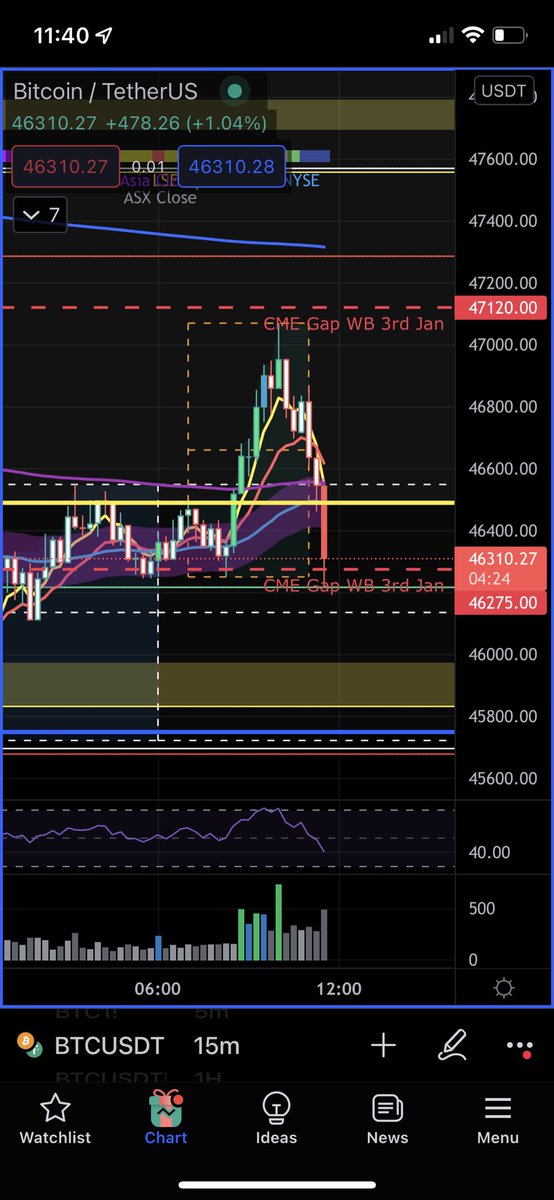
4/ So my plan Thursday is to look for a sweep of the lows of $45400 and for the potential of coming back up to around the $48k mark.
Of course the sweep of the lows may not happen. Also, they may just continue to drop or just hold it here, but these would be my triggers to long
Of course the sweep of the lows may not happen. Also, they may just continue to drop or just hold it here, but these would be my triggers to long

5/ One thing is for sure - it's the Asian session now and there's no chance i'm taking a punt on longing it atm. Let Asia do their thing and see what they've done overnight.
NYC is usually the one to bring about reversals and i'm playing the probabilities.
NYC is usually the one to bring about reversals and i'm playing the probabilities.
6/ To clarify my triggers for a long, I want to see any or all of these:
- Red/pink vectors at the lows and not pushing price down further
- A stopping volume candle at the lows
- A sweep of the lows with reversal vectors (red/green, pink/blue) bringing it back into the range
- Red/pink vectors at the lows and not pushing price down further
- A stopping volume candle at the lows
- A sweep of the lows with reversal vectors (red/green, pink/blue) bringing it back into the range
7/ Ie something like what they're doing now but at a sweep of $45400

8/ I want to talk some more about the sweep of the lows and why i'd personally like to see it. The bottom of this range is around 45400. It's been hit 3 times and we're now on a 4th. This is now seen as big support for most Retail Traders. So where will they place they stops?
9/ Below the lowest low at 45400. And where would breakout shorters orders be triggered? Below 45400.

10/ The only time I use trend lines is to see where areas of manipulation may occur. Look at this trend line. A sweep of the lows can be achieved by bouncing off it. Then we'd see the tweets saying "bullish retest" achieved.

11/ Lastly, anyone able to send me a screenshot of what Bookmap looks like at the moment? The feed I use is down and Bookmap isn't loading on my Mac atm.
But last time I checked it there was a huge stack of orders at $45k
But last time I checked it there was a huge stack of orders at $45k
12/ Bookmap. Thick red block of orders at $45k.
https://twitter.com/YourBlacknWhite/status/1476374593069891589?s=20
13/ In this range: Shorts have continued to drop. Longs have continued to grow.

16/ Worth providing the counter scenario too: In the event that they don’t bounce between 44.5-46k and none of these triggers come then I’m afraid 41k is the next logical area to look at
NOTE: I will not blindly long at the area I mentioned. I want to see some of these triggers
NOTE: I will not blindly long at the area I mentioned. I want to see some of these triggers
https://twitter.com/Crypto_MM_/status/1476354054309752833
17/ Not doing anything until I see what NYC do upon open in around an hour.
We’re going up and Thursdays are known for NYC Reversals, so I wouldn’t be too excited about this rise yet.
We’re going up and Thursdays are known for NYC Reversals, so I wouldn’t be too excited about this rise yet.
18/ You guys know what usually happens when Saylor tweets this right?
More often than not price goes down.
Also bearing in mind that 48k is max pain for options expiry so we may not see much happen today. Tomorrow’s option expiry max pain price is 47k
More often than not price goes down.
Also bearing in mind that 48k is max pain for options expiry so we may not see much happen today. Tomorrow’s option expiry max pain price is 47k
https://twitter.com/saylor/status/1476539985562152960

19/ Dropping down to the 15m there are blue vectors at the highs. Possibility they create an M pattern here $btc #Bitcoin

20/ Also there’s this bad news too.
Just be careful, next few days and start of the New Year could bring some volatility. I’m still waiting to see what NYC does today before doing anything
cnbc.com/2021/09/27/cry…
Just be careful, next few days and start of the New Year could bring some volatility. I’m still waiting to see what NYC does today before doing anything
cnbc.com/2021/09/27/cry…
22/ If i haven’t made it clear with my tweets I’m now looking at a short opportunity. Price movement this morning and the news coming out has made me change my bias. However I have to go out in an hour (bad timing ffs), so if i don’t see anything before then i might just stay out
23/ This time it's different though, right?
These aren't cherry picked. This is the last 9 times that Saylor has tweeted about Microstrategy buying #Bitcoin.
Dump rate: 9 out of 9. #btc $btc
These aren't cherry picked. This is the last 9 times that Saylor has tweeted about Microstrategy buying #Bitcoin.
Dump rate: 9 out of 9. #btc $btc

Would appreciate some retweets on this please.
24/ They held around 48k in line with the options expiry. Tomorrow’s is 47k.
The possible M I posted earlier actually turned into a nice W formation which would have been a nice scalp if I was about.
The only question left now is how do they kick off the New Year
The possible M I posted earlier actually turned into a nice W formation which would have been a nice scalp if I was about.
The only question left now is how do they kick off the New Year

25/ Bitcoin Dominance is still at the lows. Red vectors have been appearing on the daily yet it’s not going down further. I’m still expecting a bounce. I’ve attached the cheat sheet for what that would mean


26/ All options for the year have now expired. They achieved their goal of holding it at 47/48k. It’s now time to start a clean slate and see what January brings us.
https://twitter.com/Crypto_MM_/status/1476674373130014729
27/ Haven’t been looking at the charts much today. It is NYE after all. Lots of fuckery by MM this holiday season.
Still looking at a potential long entry for this plan, however it’s coming into the weekend and the weekend is scam move central.
Still looking at a potential long entry for this plan, however it’s coming into the weekend and the weekend is scam move central.
https://twitter.com/Crypto_MM_/status/1476353258893549569
28/ Bookmap as it stands.
I'll be looking to see what they do around $45400 if we get there
Live feed:
I'll be looking to see what they do around $45400 if we get there
Live feed:

29/ This time was not different.
✅ Saylor announces purchase
✅ MM pushes price up to get people to fomo in on 'bullish' news
✅ Hold
✅ Dump
✅ Saylor announces purchase
✅ MM pushes price up to get people to fomo in on 'bullish' news
✅ Hold
✅ Dump
https://twitter.com/Crypto_MM_/status/1476565932654923784?s=20

30/ Keep an eye on what happens at these two levels if it comes to it:
- Previous weekly low
- Quarterly open
The indicator is SpacemanBTC Key Levels. I highly recommend using it
- Previous weekly low
- Quarterly open
The indicator is SpacemanBTC Key Levels. I highly recommend using it

31/ Don’t get too carried away by any rise up this weekend. A reminder that the CME gap will be formed at the lows of this range we’re in. I’ll post the full CME gap later when it’s confirmed #Bitcoin

32/ Current price is $47800

33/ 1, 2, 3 taps. Hit the previous daily high, set a trap for breakout longs. Pull straight back. Standard MM fuckery.
That’s a green/red vector reversal
That’s a green/red vector reversal

🤡


34/ This week’s CME gap is: $46275 - $47120
A reminder: 90% of CME gaps are closed.
Find out more about the #Bitcoin CME Gap here: coinfomania.com/cme-bitcoin-ga…
A reminder: 90% of CME gaps are closed.
Find out more about the #Bitcoin CME Gap here: coinfomania.com/cme-bitcoin-ga…

35/ Reversal vector on the 1hr. That CME Gap wasn't fully filled by Asia last night or London this morning.


37/ They've done it.
Still with my plan from earlier in this thread and looking to see if they sweep the lows and tap around $45400. Will be looking for reversal patterns between there and $44k
Still with my plan from earlier in this thread and looking to see if they sweep the lows and tap around $45400. Will be looking for reversal patterns between there and $44k

That reversal vector pattern played out well huh
https://twitter.com/Crypto_MM_/status/1477744654779142148
38/ Getting closer…

39/ Will be shocked if this daily candle doesn’t end as a red vector. So many red vectors on the 1hr

40/ I think if we get a red vector on the daily AND it closes above $45670 we could get this scenario as long as Asia doesn't just straight nuke it.
Seeing similarities from July. So many red vectors today but it's been a bit of a slow move down.
Seeing similarities from July. So many red vectors today but it's been a bit of a slow move down.


41/ If we get a fast drop at some point over the next two days to between the marked yellow lines, panic ensues.
That's what happened in July. That was the most bearish i'd ever seen Twitter because for a whole day it stayed below the low that they'd held for weeks. #bitcoin
That's what happened in July. That was the most bearish i'd ever seen Twitter because for a whole day it stayed below the low that they'd held for weeks. #bitcoin
I wanna long right now but don’t like taking long positions just before Tokyo opens. Think I’m better waiting for a safer time in the week
42/ Daily did not finish as a red vector despite how active they were today with the vectors. You can see the second leg looking like a mini W possibly forming

44/ Another night where Asia didn’t dump.
Imo they’ve either set the low they want to go to or else they’re waiting for New York to do the dirty manipulation part spoken about in this tweet.
Imo they’ve either set the low they want to go to or else they’re waiting for New York to do the dirty manipulation part spoken about in this tweet.
https://twitter.com/Crypto_MM_/status/1478119006037028868
45/ This candle hasn't finished yet, but there's a green/pink vector reversal on the 1hr. Waiting for a confirmation M pattern on lower timeframes before I consider shorting as they could just continue on up #bitcoin $btc

46/ This candle is turning into a bearish engulfing...
Not closed yet!
Not closed yet!

47/ Reversal vectors called the move again. No, I didn't go short. As said earlier I didn't feel I had a good grasp of the markets today.
I think they're finally going to break the lows of $45400 tonight
I think they're finally going to break the lows of $45400 tonight
https://twitter.com/Crypto_MM_/status/1478119006037028868?s=20

This is a pretty key moment now imo. Are they building up to a reversal upwards on Thursday during the NYC Reversal?
48/ This is the 9th time they've hit these lows. I'm not believing this bounce this time. I believe they go lower to around $44k but they want to breakout shorts first
Live Bookmap:
Live Bookmap:


want to squeeze breakout shorts first*
49/ If some thing like this happens on the 5m chart with a vector on the top right shoulder of the M pattern that doesn't break above the daily open then i'll look to scalp short. I believe that wick on the 4hr will get recovered

I'm in, will cut it if they move and sustain above the daily open

There's no vector, but looking at the candlesticks there's 3 pins to the ema.
Some would call it a rejection of the ema.
Some would call it a rejection of the ema.

50/ Wick almost fully recovered. They're dropping it right before the Asian open. Honestly, if Asia don't drop it even further tonight i'll be surprised.
Stop loss moved to break even long ago. $btc #bitcoin #btc
Stop loss moved to break even long ago. $btc #bitcoin #btc


Hoping they don't actually nuke it though... A nice gentle drop would do nicely, please MM
51/ Asia didn’t dump 😵
However that’s another reversal pattern, blue red vectors. All eyes on NYC session in 3 hours. Might be a big day.
However that’s another reversal pattern, blue red vectors. All eyes on NYC session in 3 hours. Might be a big day.

52/ I’ll remind you of my plan. Looking for scalp shorts above 46k. Looking for swing longs between 44k-45k.
Won’t just blindly long at that area, want to see a reversal pattern.
The volatility squeeze is coming. I think we see the bottom by tomorrow.
Won’t just blindly long at that area, want to see a reversal pattern.
The volatility squeeze is coming. I think we see the bottom by tomorrow.
I was asleep, only awake when i posted this. But did anyone take a short upon seeing those reversal candlesticks?
Was another Burj Khalifa
Was another Burj Khalifa

53/ Look at the last two 3 Day candles and the current one.
3x inverted hammer, and nearly 2x inside bars
3x inverted hammer, and nearly 2x inside bars


Reminder: See these images
https://twitter.com/Crypto_MM_/status/1478344116815675393
52/ Looking at the 12 hours there are multiple pink vectors on the way down but they still haven’t broken the lows. They are building their longs.
Anything below 45.5k is manipulation designed to scare people - as what retail traders call ‘support’ will be broken.
Anything below 45.5k is manipulation designed to scare people - as what retail traders call ‘support’ will be broken.

The real fun starts in 90mins when NYC Futures opens
53/ My take on BTC Dominance. You can see they've broken the lows. Bitcoin looks like it's about to make a big move soon. IMO upwards, after a short term move below the current lows

54/ Pretty much most alts are pumping today right before NYC opens, it's rare this happens from what I remember. I see it as distribution. Last time it happened I remember there was great volatility and Bitcoin made a big move. Alts got rekt.
55/ The timing is too good IMO. Pump alts, make Bitcoin Dom look like it's falling into the abyss - people start getting extra bullish on Alts and swap their Bitcoin for them. BTC ultimately reverses and Alt Season is over as BTC Dom strikes back.
Just my personal thoughts on it
Just my personal thoughts on it
56/ Looking like an M developing on the 5m and 1m $btc

57/ Max pain for options expiry tomorrow is 46k. On Friday it's 48k. Will be keeping this in mind.

57/ They REAALLLLY going to bounce here again? C'mon man. Take out the stops and be off with it.

58/ Looks likely that today's Daily finishes as an inverted hammer and that's be 4 consecutive red days. Those are trend reversal sort of candlesticks.
My best guess is tomorrow we get a true reversal upwards. Options expiry for the morning is 46k, after that it's 48k for Fri.
My best guess is tomorrow we get a true reversal upwards. Options expiry for the morning is 46k, after that it's 48k for Fri.

59/ Ie i'll be looking for longs once that 46k max pain options expiries tomorrow morning. You can keep track of options expiries here: metrics.deribit.com/options?index=…
FINAAAAALLLLLLLYYYYY

Don't capitulate here! Now is not the time to be capitulating!
59/ Keep these two pictures in mind if you're thinking about capitulating here $btc #btc #bitcoin #bitcoincrash
https://twitter.com/Crypto_MM_/status/1478119006037028868?s=20
60/ Let them consolidate here. Don't go longing it right now. That was a big move. They could go lower. But now is not the time to be trying to be going gung ho.
They will consolidate and give a pattern if/when they are going to reverse.
I think 48k by Friday is reasonable.
They will consolidate and give a pattern if/when they are going to reverse.
I think 48k by Friday is reasonable.

61/ July bottom 15m timeframe vs current 15m timeframe.
I'm not interested in fractals, but I will be looking for similarities in price action. $btc
I'm not interested in fractals, but I will be looking for similarities in price action. $btc


62/ By the way, last quarter's open was taken. Price hit $43722
https://twitter.com/Crypto_MM_/status/1477033394957701123?s=20
63/ See how the buy wall at 43k has intensified in red? I think we're close to the bottom.

64/ Alts bleeding badly. Bitcoin Dominance bouncing hard
https://twitter.com/Crypto_MM_/status/1478735038762172418?s=20

65/ Buy wall getting less red. That's not a good sign...

66/ And it's back. This is a fun watch

67/ Fuck. What if it's the other way around and its 40857 to 53760?
(Read the previous tweets in that thread for the context of the wild conspiracy theory)
(Read the previous tweets in that thread for the context of the wild conspiracy theory)
https://twitter.com/Crypto_MM_/status/1468797155729096705?s=20
68/ After a big price move it's always best to just let the price settle down and form a range.
Here's a few tweets I wrote last week about what I had learnt from being in the range above that we were just in:
Here's a few tweets I wrote last week about what I had learnt from being in the range above that we were just in:
https://twitter.com/Crypto_MM_/status/1475842169047064578?s=20


70/ Just like we have False Move week beginning I think we’re seeing a False Move Quarter/Year beginning here. It’s literally the first week MMs are back after Christmas and they’re dropping price immediately at the start of the year to get their orders filled as low as possible
71/ The bottom is near. 53.6k/53.7k is not an unreasonable target and could easily be hit by end of Jan/mid Feb
72/ Personal feeling is that was the bottom. Timing feels right. We may revisit that wick, but i don’t think we’re going much further down at all #bitcoin

73/ They’ve dropped it right before the NYC session coinciding with this news. The last time important news like this came out it was the opposite move, fast move up then it went straight back back down
Dollar going down is good news for Bitcoin
Dollar going down is good news for Bitcoin
https://twitter.com/tier10k/status/1479445719337607179

74/ Bitcoin shorts keep closing. Eth longs keep rising. Both good news.
I am already partially long. Today’s NYC session (in 30mins) is important. If they drive it back it up I’ll add to my long.
I am already partially long. Today’s NYC session (in 30mins) is important. If they drive it back it up I’ll add to my long.


76/ Look at how many red vectors we have at the lows here and yet didn’t push price down further. And that’s red/blue vector reversal #Bitcoin


77/ Plus we have what looks like a W forming on the 1hr and the potential for an inverted head and shoulders on the 4hr


78/ Bid wall below is increasing as price goes up. They are driving it up

79/ Daily has turned into a pink vector. If it closes above that wick on the left then it’ll give me even more belief that we’ve seen the bottom today $btc


81/ Btw i wasn’t being overly bearish in that previous tweet. But if we get a weekend pump i may look to short it come once the weekend is over. The CME Gap will be $41755 - unknown (we’ll only know on Sunday night)

82/ I hate using trend lines but noooo, it can’t be this easy can it?
Can it?! It could be.
Look at the linked tweet. That’s precision
Can it?! It could be.
Look at the linked tweet. That’s precision
https://twitter.com/Crypto_MM_/status/1476374385388892166

83/ The last time the Fear and Greed Index was at 10?
July @ $29k.
July @ $29k.
https://twitter.com/BitcoinFear/status/1479777430831308802
84/ Look at the 1hr. 3 red vectors in a row and all they’ve done is hit yesterday’s low. The last candle had much more tick volume yet didn’t push price much further down.
There may be a little more downside to break 40k but to me these 3 vectors show their real intention
There may be a little more downside to break 40k but to me these 3 vectors show their real intention
https://twitter.com/Crypto_MM_/status/1479879708150009859

85/ And by break 40k i mean that that’s the headline news they may want spread “OMG Bitcoin’s below 40k, sell sell sell”.
Yet in the end the possibility of it just ending as a wick on the higher timeframes is high.
Yet in the end the possibility of it just ending as a wick on the higher timeframes is high.
86/ 5 vectors in a row yet not breaking the low they created yesterday. That’s telling
Currently has a blue stopping volume candle
Currently has a blue stopping volume candle

87/ Late shorts in pain.
This is why you need vector candles. They help tell the true story.
Indicators below
This is why you need vector candles. They help tell the true story.
Indicators below


Just think hope many panic sold at the bottom. Fear was so high today with that price action.
Ridiculous manipulation today.
Ridiculous manipulation today.
Just think how many*
Hope was a typo. I hope no one sold during that. That was designed to squeeze more fear. Consecutive red vectors like that that don’t go anywhere usually signal a reversal is incoming. There were 4 of them and then the final blue one was a reversal vector
Hope was a typo. I hope no one sold during that. That was designed to squeeze more fear. Consecutive red vectors like that that don’t go anywhere usually signal a reversal is incoming. There were 4 of them and then the final blue one was a reversal vector
88/ HYPOTHETICAL SCENARIO:
If (and I stress the IF) they run Bitcoin up and away from 40k today and leave a CME Gap that they don’t recover I will be worried about the longer term direction of this market.
To me that would be a calling card for another plunge after a bounce.
If (and I stress the IF) they run Bitcoin up and away from 40k today and leave a CME Gap that they don’t recover I will be worried about the longer term direction of this market.
To me that would be a calling card for another plunge after a bounce.
89/ Scam Sunday pump incoming?

91/ This week’s CME Gap is almost non existent - $41775-$41850. Imagine it’ll get filled right at the Asian open.

92/ A reminder that I’m in a long and I’m looking for a first couple of targets of around 44600 and 46600. I think these are achievable mid term. A break below 40857 and I’ll be concerned

94/ Reminder that Sundays and Mondays are known for false moves.

95/ Keeping an eye on the 4hr chart (top left) and whether they finish it up inside that range. #bitcoin

96/ You can see the red/green vector reversal on the 15m.
https://twitter.com/Crypto_MM_/status/1479881292112089094?s=20

97/ That was a pretty epic false move. Liquidations central. Took out as many stops as they could as well.
Did you see the panic on CT when they broke 40k? Let's see a proper short squeeze this week. Give us a fucking bounce for once. #bitcoin
Did you see the panic on CT when they broke 40k? Let's see a proper short squeeze this week. Give us a fucking bounce for once. #bitcoin
https://twitter.com/Crypto_MM_/status/1480550616502087684?s=20

98/ Let’s see if this W plays out

99/ If Asia bring Bitcoin up tonight and there’s green vectors at the top not pushing price up further than $42800 then I’ll be looking to scalp short tomorrow. Asia pumping isn’t a good sign typically

You want to see NYC pump. Not London or Asia. They are the ones who set it up for what NYC are going to do. Believe there’s a FED meeting tomorrow that could bring about some volatility
100/ Closed my long position in profit and opened a small short. Don't like the fact it was Tokyo who brought it up upon Daily Open and there was such little follow through from the reversal vectors earlier. Looking to come back to the bottom of the range (yellow box) at $40600


101/ Max pain price for options expiry on Friday is 44k. So I’ll be looking for signs of a New York reversal on Thursday that’ll bring us out of the current range we’re in and up to there

102/ Was stopped out of my Bitcoin short after the first TP and it went back to entry. This move up today may have been a trap but personally looking for an M pattern on the lower timeframes before i get involved in this reversal candlestick pattern

103/

104/ I believe this is a W forming and that London are setting it up for a New York reversal. Given the state of open interest at the moment i think that shorts are going to get squeezed here

105/ What a trap. Sick bastards.
Have some exciting news about this though that’ll come when I reveal what I’ve been working on.
All I’ll say is on the 15m you would have been prepared for this reversal.
Have some exciting news about this though that’ll come when I reveal what I’ve been working on.
All I’ll say is on the 15m you would have been prepared for this reversal.

106/ Options expiry max pain price for tomorrow is 44k. Are they going to run it back up? 🤔 They bounced it off the previous range top. (Yellow box)


107/ CME Gap this week is practically non-existent. Not worth worrying about as Asia will close it straight from the open.
On the plus side I have Version 7 of the indicator which now plots the CME Gap on Bitcoin and Weekend Gaps on Altcoins.
Indicator not 100% ready tho
On the plus side I have Version 7 of the indicator which now plots the CME Gap on Bitcoin and Weekend Gaps on Altcoins.
Indicator not 100% ready tho

108/ The only positive I can give you right now is that this daily has turned into a red vector AND an inverted hammer... for the moment.
However, let's remember that the daily hasn't closed yet. #bitcoin
However, let's remember that the daily hasn't closed yet. #bitcoin

109/ Please give a green vector reversal on the daily today.
I don't see it happening, but at this stage it's really all the hope I have left
I don't see it happening, but at this stage it's really all the hope I have left

110/ Today's daily is already a red vector with over 8hrs to go. The 3d has also turned red.
Still, doesn't look great at all. But IF they finished the day above around $40700 then things would look much better on the higher timeframe.
Still, doesn't look great at all. But IF they finished the day above around $40700 then things would look much better on the higher timeframe.

111/ But if i'm honest I kind of feel i'm clutching at straws here trying to look for an optimistically bullish angle.
Tbh the only way out of this is if everyone stops longing and starts going short so the balance of liquidations is to the upside 🙄
@kingfisher_btc's liquidations map earlier didn't fill me with confidence seeing that liqs are still balanced to below
@kingfisher_btc's liquidations map earlier didn't fill me with confidence seeing that liqs are still balanced to below
https://twitter.com/kingfisher_btc/status/1484473888960569346?s=20
112/ Just got a raft of bullish reversal vectors alerts on the indicator I’m testing.
Looks like they’ve got their fill here for the moment.
Looks like they’ve got their fill here for the moment.
113/ Remember - around 80% of the time the moves made on Saturday and Sunday are retraced.
They’ve created upside gap in the chart by making this move this morning so personally I’ll be looking to scalp long on some coins.
For bitcoin this gap started at 36440
They’ve created upside gap in the chart by making this move this morning so personally I’ll be looking to scalp long on some coins.
For bitcoin this gap started at 36440
114/ Today's daily candle is already a vector - that's early. That's 3 in a row.
The last time 3 consecutive vectors happened was Oct 2019 - they were green or blue and a huge dump followed.
I'll be keeping an eye on the daily to see if we get a bullish reversal alert
The last time 3 consecutive vectors happened was Oct 2019 - they were green or blue and a huge dump followed.
I'll be keeping an eye on the daily to see if we get a bullish reversal alert


116/ Potential for a W to form here $btc
The CME gap for this weekend will be from wherever we finish today's daily to the green line around $36345
There's also an unfilled CME gap below at $32400 which was created in July that we have to mindful of if the W doesn't play out
The CME gap for this weekend will be from wherever we finish today's daily to the green line around $36345
There's also an unfilled CME gap below at $32400 which was created in July that we have to mindful of if the W doesn't play out

117/ W formation playing out! Literally hit the top of the CME Gap!


Also, didn't mean to show the indicator there but you can see the Bearish Vector Reversal PDI label from earlier on the 5m. PDI = Potential Dump Incoming
You can see how the previous label didn't mention it as a PDI. But when the PDI came it called the biggest drop of the day.
You can see how the previous label didn't mention it as a PDI. But when the PDI came it called the biggest drop of the day.

118/ Bitcoin actually closed a day positive for once! 😅
No green reversal vector as i'd hoped, but hey it's a start!
Personally i'm expecting a little bit of up this week.
Also the CME gap is only $200 difference - $36258 to $36435
No green reversal vector as i'd hoped, but hey it's a start!
Personally i'm expecting a little bit of up this week.
Also the CME gap is only $200 difference - $36258 to $36435


119/ That CME Gap up above wasn't fully closed. Seems odd they didn't fully close it when they were right there at the time.
However we're now closer to filling the CME gap at $32400
Hopefully they fill that and then just fuck off back upwards for a bit
However we're now closer to filling the CME gap at $32400
Hopefully they fill that and then just fuck off back upwards for a bit
https://twitter.com/Crypto_MM_/status/1485403771052122112?s=20

120/ Just got a raft of 4hr bullish vector reversal candles on my alerts system.
On $link $dot $btc $eth $alice $matic $chr $ftm
4hr is usually a strong sign for at least a short term reversal
However it worries me that the CME gap at $32400 wasn’t fully closed
On $link $dot $btc $eth $alice $matic $chr $ftm
4hr is usually a strong sign for at least a short term reversal
However it worries me that the CME gap at $32400 wasn’t fully closed
121/ Maybe the CME gap was filled on some scammy exchange like ByBit or something?
122/ Price action looking good on the 1hr and 15m, no vectors to be seen. That’s what you want to see when they’re coming out of an important zone. No vectors below means less reason to return
Yes there’s one on the 4hr but that was a reversal vector at the very very bottom
Yes there’s one on the 4hr but that was a reversal vector at the very very bottom
…most of which was recovered by a wick.
123/ Possibility of an inverted h&s forming #bitcoin #btc
Vector Candle Reversal (which i'll be calling VCRs from now on cus that's too much of a mouthful) on the 4hr are powerful signs.
This is why I want the alerts set up. I got a raft of them when that 4hr candle closed
Vector Candle Reversal (which i'll be calling VCRs from now on cus that's too much of a mouthful) on the 4hr are powerful signs.
This is why I want the alerts set up. I got a raft of them when that 4hr candle closed

124/ SHIT IS GETTING INTERESTING
Today's daily is currently a blue vector. The 3 Day is also about to close tonight and is a pink vector currently.
If they turn green or blue I would classify those as Vector Reversal Candles. $btc #btc #bitcoin
Today's daily is currently a blue vector. The 3 Day is also about to close tonight and is a pink vector currently.
If they turn green or blue I would classify those as Vector Reversal Candles. $btc #btc #bitcoin

125/ Why would I count the daily as a VCR? Look at the top at 69k, we had a green vector, then a normal candle then it was followed by a red vector. This signalled the huge reversal we've been in.
125/ USDT Dominance is wicking to the highs.
Right now this is the only M pattern I want to see incoming on any chart.
Let's revisit this in a few weeks.
Right now this is the only M pattern I want to see incoming on any chart.
Let's revisit this in a few weeks.

@RemindMe_OfThis in 4 weeks
126/ Pretty much every sign i'm seeing today is indicating a bounce at the very least. We have FOMC this week which could be what MM was working towards
Is it the bottom? Not going to call it, but with influencers now finally giving their bearish targets maybe it is 😅
Is it the bottom? Not going to call it, but with influencers now finally giving their bearish targets maybe it is 😅
126/ CME Gap at $36435 fully closed now.
So that's why they left it behind.
Nice.
So that's why they left it behind.
Nice.
https://twitter.com/Crypto_MM_/status/1485590117981040641?s=20
• • •
Missing some Tweet in this thread? You can try to
force a refresh