Pinned Tweet regarding the free 6 part PA Principles Course that starts 01 Jan 2022, then released weekly
I'll sequentially share each Module's PDF, Video, and then QA session as we go as a tack on to this tweet.
Modules 1 to 6 are below (shared as they release)
I'll sequentially share each Module's PDF, Video, and then QA session as we go as a tack on to this tweet.
Modules 1 to 6 are below (shared as they release)
Module 1 - Market Structure & Fibonacci
PDF Download
bit.ly/MindsetBTC_Mod… - Original
bit.ly/Module1Printer… - Printer Friendly
PDF Download
bit.ly/MindsetBTC_Mod… - Original
bit.ly/Module1Printer… - Printer Friendly
Module 1, Market Structure & Fibs
Video
Video
Module 2, Orderblocks, Breakers & Fib Dynamics
Original PDF
bit.ly/Mindset_BTC_Mo…
Printer Friendly PDF
bit.ly/Module2Printer…
Video will be posted as a response to this tweet when ready
Original PDF
bit.ly/Mindset_BTC_Mo…
Printer Friendly PDF
bit.ly/Module2Printer…
Video will be posted as a response to this tweet when ready
Module 2 Orderblocks, Breakers, & Fib Dynamics
YouTube Video below (update to pinned tweet)
Module 3 out soon!
Cheers
YouTube Video below (update to pinned tweet)
Module 3 out soon!
Cheers
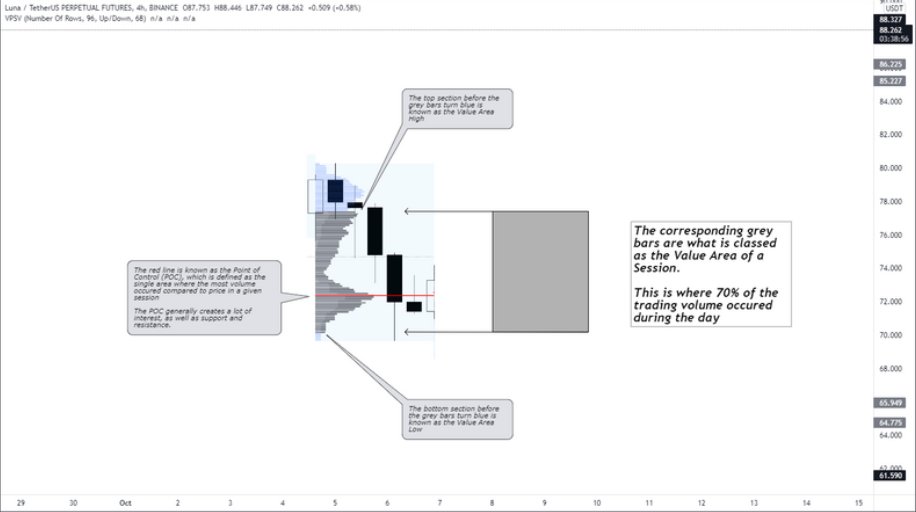
Module 3 Volume Profile & Tools
Original and Printer Friendly Modules
Original and Printer Friendly Modules
https://twitter.com/Mindset_BTC/status/1480524831758053376?s=20
Module 3 Volume Profile & Tools
Video link in quoted tweet
🤝🍻
Video link in quoted tweet
🤝🍻
https://twitter.com/Mindset_BTC/status/1481275037768622085?t=Qb526s93q7NQNxW6Vcuk2g&s=19
Module 4- Ranges, Liquidity, & Targets
Original:
bit.ly/MindsetBTC_Mod…
Printer Friendly:
bit.ly/Module4Printer…
Video:
Original:
bit.ly/MindsetBTC_Mod…
Printer Friendly:
bit.ly/Module4Printer…
Video:
Module 5 - Trade Management & Psychology
Original
bit.ly/MindsetBTC_Mod…
Printer Friendly
bit.ly/Module5Printer…
Excel Journal
bit.ly/Mindsetsjournal
Trading Personality Test
dailyfx.com/research/dna-f…
Original
bit.ly/MindsetBTC_Mod…
Printer Friendly
bit.ly/Module5Printer…
Excel Journal
bit.ly/Mindsetsjournal
Trading Personality Test
dailyfx.com/research/dna-f…
• • •
Missing some Tweet in this thread? You can try to
force a refresh