
New preprint @PsyArXiv from @LinChujun & me! "Fooled by beautiful #data: #Visualization aesthetics bias trust in science, news, and social media." Across 4 studies, we show that people (mis)place more trust in more beautiful graphs. Paper: psyarxiv.com/dnr9s/ Explainer 🧵👇 


As data have become more plentiful and important to our daily lives, data visualizations have become common across many spheres, including the news media (e.g., @FiveThirtyEight), social media (e.g., @DataIsBeautiful), and scientific research in academia and industry.
People use data visualizations - such as Covid tracking graphs, weather forecast maps, stock price charts - to interpret the world, and make important decisions. Ideally, these graphs can improve those decisions, but misleading graphs can also bias and confuse us.
When people judge other people, they show many biases, including halo effects, and more specifically the "beauty-is-good" stereotype: they think that more beautiful people are more likely to have other, unrelated positive qualities, such as competence. psycnet.apa.org/record/1973-09…
We hypothesized that these biases might extend to data visualizations: that people would overgeneralize from one good quality of a graph (its aesthetics) to another (the trustworthiness of the data).
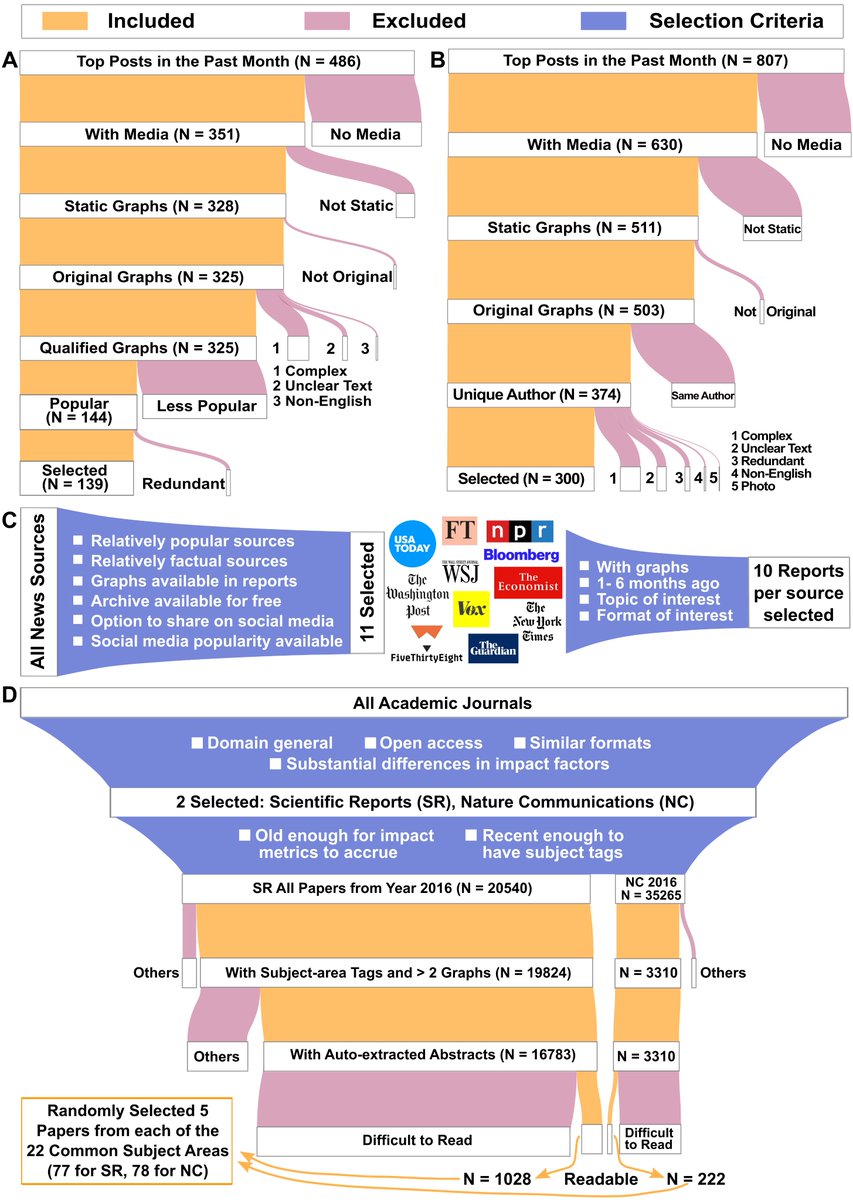
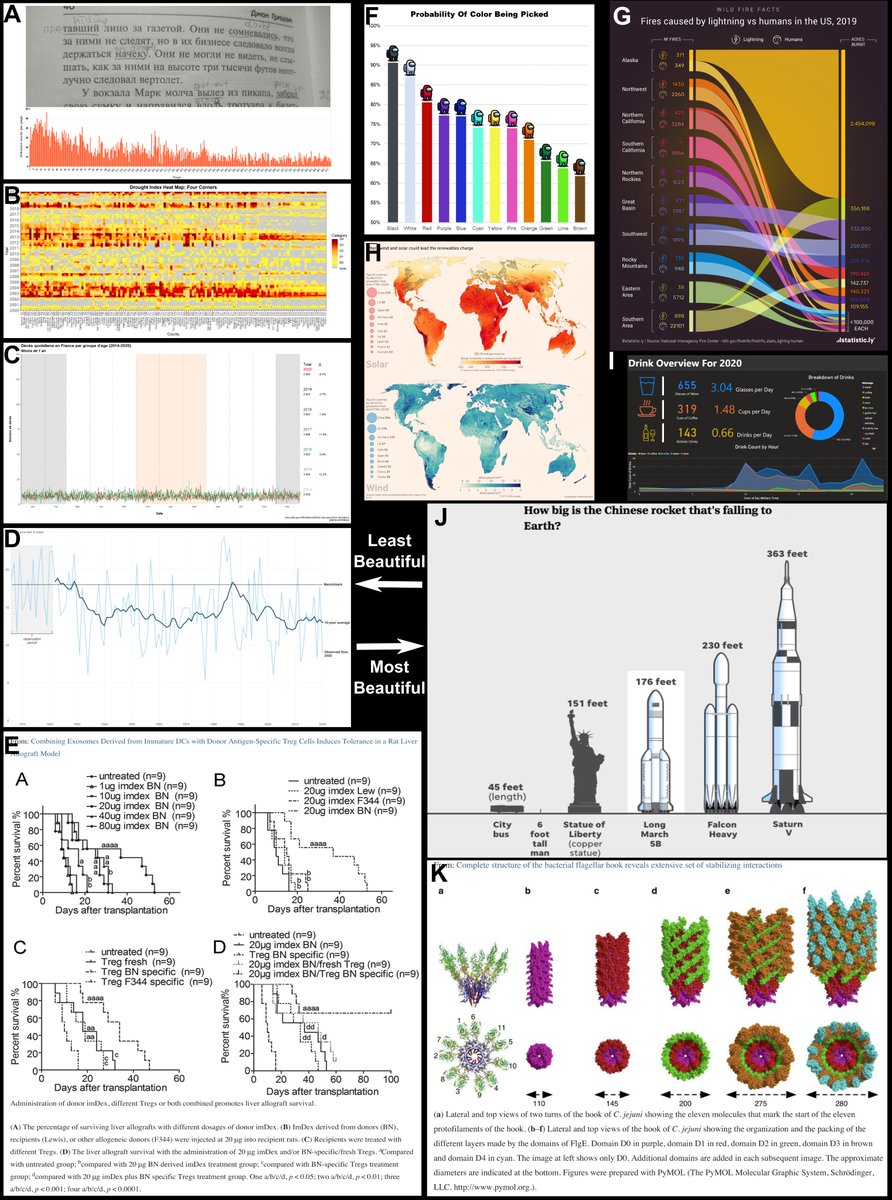
We systematically sampled 100s of graphs from diverse sources, including the r/DataIsBeatiful subreddit @Reddit, journalistic articles at news outlets such as @NPR, @WSJ, @nytimes, and peer-reviewed scientific papers from @NatureComms & @SciReports.

This sampling procedure helped us to maximize the generalizability of our research by furnishing us with stimuli representing many different types of graphs, and many different topics.

We then presented these graphs to participants recruited from @amazonmturk in a serious of 4 well-powered, pre-registered studies. Participants rated the beauty of each graph, how much they trusted it, and several other potentially important features shown in panel A below.

In all four studies, we found a statistically significant positive associations between trust and beauty rating, even after statistically controlling for potential confounds and dependencies. Beauty explained ~15-20% of the variance in trust.

We also found that beauty predicted several "real-world" outcomes related to the graphs, including how many comments were made on the graphs from @Reddit, and how many citations scientific articles received.
Finally, we conducted a stronger causal test of the effect of beauty on trust by generating graphs of multiple types with arbitrary data, and manipulating their beauty. At the same time, we also manipulated whether the graphs were actively misleading in some respect.

Our results showed that increasing graph beauty had a large, and statistically significant, causal effect on participants' trust. Moreover, participants were completely insensitive to the actual misleadingness of the graphs (e.g., truncated axes, non-uniform color mappings).

General education level did not mitigate the graph beauty-trust bias in any study. If anything, more educated participants tended to trust more beautiful graphs even more. That said, we did not specifically target data-visualization experts in these studies.
These results have far-reaching implications for science, journalism, and social media. In science, the critical processes of peer review and citation could potential be skewed by this bias, leading to papers with flashier graphs getting published and cited more often.
(Some may argue that graph aesthetics are a genuine indicator of quality. They may indeed be correlated, but we found that it was easy to make graphs appear much more beautiful with relatively minor tweaks that would require minimal technical knowledge.)
In journalism and social media, the use of more beautiful data visualizations may contribute to whether people trust and help disseminate #misinformation.
More generally, our results highlight the importance of incorporating more data literacy content into all levels of education. Doing so will empower people to use graphs to inform better decisions, and hopefully inoculate them against biases such as the one we have demonstrated.
Offering further training to data visualization practitioners could also help, by making graphs more uniformly beautiful, minimizing actual misleadingness, and ensuring accessibility to as wide an audience as possible (e.g., including people with vision-related disabilities).
All of our data, code, and preregistrations are openly available on the Open Science Framework (@OSFramework) here: osf.io/yutgx We welcome feedback on this work!
• • •
Missing some Tweet in this thread? You can try to
force a refresh


