
Assuming:
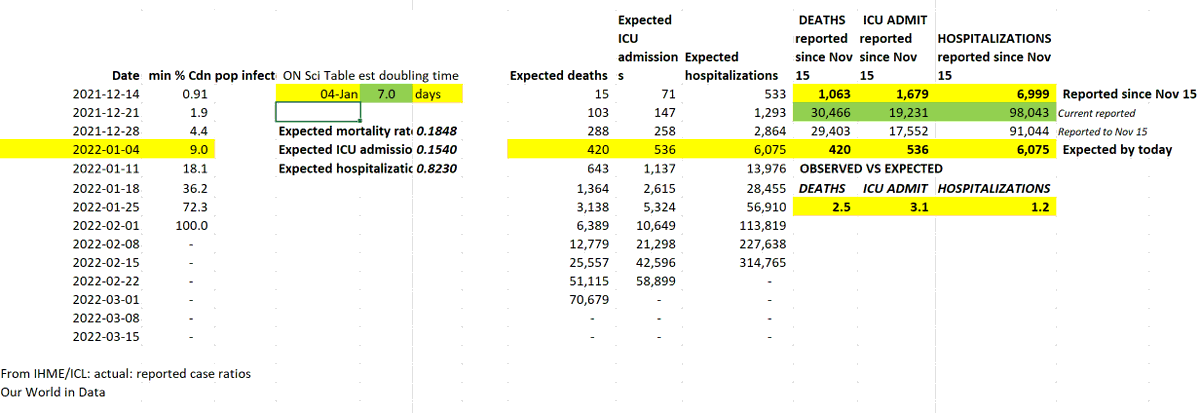
🔵9% Cdn pop infected Nov 15-Jan 4
🔵Omicron fatality, ICU admit rates 50% Delta, hosp rates 70% Delta
🔵2, 3, 4 week lag: hosp, ICU, death
We'd expect 420 deaths, 540 ICU admission, 6,100 hosp's for this period.
Reported: 1,063 deaths, 1,679 ICU, 6,999 hosp
🔵9% Cdn pop infected Nov 15-Jan 4
🔵Omicron fatality, ICU admit rates 50% Delta, hosp rates 70% Delta
🔵2, 3, 4 week lag: hosp, ICU, death
We'd expect 420 deaths, 540 ICU admission, 6,100 hosp's for this period.
Reported: 1,063 deaths, 1,679 ICU, 6,999 hosp
This is based on Cdn pop age structure, age-specific vax rates, IFRs.
If Omicron causes 50% less deaths than Delta the expected national mortality rate is 0.1848, assuming there has been NO Omicron reduction in the 90% protection vs death provided by vaccines.
If Omicron causes 50% less deaths than Delta the expected national mortality rate is 0.1848, assuming there has been NO Omicron reduction in the 90% protection vs death provided by vaccines.
If Omicron causes 50% fewer ICU admissions than Delta the expected national ICU admission rate is 0.1540, based on current vaccine efficacy vs ICU admission for Omicron reported by @COVIDSciOntario
If Omicron causes 25% fewer hospitalizations than Delta (ICL estimates, unvaxxed), the expected national hospitalization rate is 0.8230, based on current vaccine efficacy vs hospitalization for Omicron reported by @COVIDSciOntario
@COVIDSciOntario Possible reasons for death, ICU being 2.5-3X higher than expected:
1. Still some Delta out there (these are national data)
2. Unvaxxed people more likely to be infected than vaxxed early on (fatality, ICU admit rates higher)
3. Omicron NOT 50% less severe, w/ breakthrough
1. Still some Delta out there (these are national data)
2. Unvaxxed people more likely to be infected than vaxxed early on (fatality, ICU admit rates higher)
3. Omicron NOT 50% less severe, w/ breakthrough
@COVIDSciOntario Another possibility is that more than 9% of Canadians have been infected since Nov 15.
To estimate actual case numbers, I took avg of ICL and IHME estimated actual: reported case numbers for Canada up to date when they're still reporting these estimates (early:mid Dec).
To estimate actual case numbers, I took avg of ICL and IHME estimated actual: reported case numbers for Canada up to date when they're still reporting these estimates (early:mid Dec).
@COVIDSciOntario For the days after the point when we no longer have estimated actual: reported ratios, I took the ratio on the last estimated day, and applied this to reported Canadian case numbers.
It is VERY likely that this is an underestimate, since test positivity rates soared thereafter.
It is VERY likely that this is an underestimate, since test positivity rates soared thereafter.
@COVIDSciOntario If Omicron is doubling every 7d (likely an underestimate, since based on reported cases), and 9% of people living in Canada were infected by yesterday,
then we're looking at 100% of pop infected by end of month.
then we're looking at 100% of pop infected by end of month.
@COVIDSciOntario It's likely we'll hit a ceiling at max 90% infected, based on vax rates, protection vs infection in people with at least 2 doses.
But it's clear now that national numbers are in that this wave is moving FAST, and/or that w/ breakthroughs Omicron may be more severe than hoped.
But it's clear now that national numbers are in that this wave is moving FAST, and/or that w/ breakthroughs Omicron may be more severe than hoped.
@COVIDSciOntario The impact of this will become so severe across the entire country at nearly the same time that I can't see how we can't go back to Wave 1 lockdowns over the next month, in hopes of preventing as many as infections as possible as soon as possible.
@COVIDSciOntario Many of those infections will likely still happen, but we MUST try to control the numbers so that they happen more slowly.
We're now seeing ICU from infections 3 wks ago (Dec 15). Deaths are from infections up to Dec 8.
Remember, cases after Dec 15 are HUGELY underestimated.
We're now seeing ICU from infections 3 wks ago (Dec 15). Deaths are from infections up to Dec 8.
Remember, cases after Dec 15 are HUGELY underestimated.

@COVIDSciOntario I have no idea why leaders are still making decisions every couple of days, and in an incremental fashion. This is a national emergency. People must realize that if Manitoba or any other province is overwhelmed very soon no other province will be able to help. Within days.
@COVIDSciOntario I hear absolutely no convincing numerical arguments and see no data presented anywhere by any Canadian leaders that explains why things will NOT be as bad as it's looking right now.
@COVIDSciOntario Journalists need to be pushing hard.
What is evidence base for leaders' decisions?
Do they have access to evidence/data the rest of us don't have supporting their decisions?
What can we expect? Put epidemiologists at front in DAILY press conferences.
Do DAILY press confs.
What is evidence base for leaders' decisions?
Do they have access to evidence/data the rest of us don't have supporting their decisions?
What can we expect? Put epidemiologists at front in DAILY press conferences.
Do DAILY press confs.
• • •
Missing some Tweet in this thread? You can try to
force a refresh


