Right. Back from leave and with a lot to report on wrt South African testing and death data! Apologies in advance for the length of the thread. BLUF: things generally looking positive.
2/ After a week’s hiatus the latest @mrcZA and @UCT_news weekly report on excess deaths in South Africa has been released. The report covers excess deaths in South Africa through 01Jan22, and is available here: samrc.ac.za/reports/report….
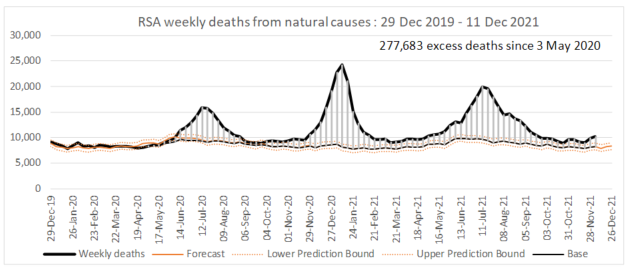
3/ A total of 286 000 excess natural deaths have been estimated since 03May20, 201 000 in 2021. We estimate 3 000 excess natural deaths in each of the last two weeks (ending 01Jan22 and 25Dec21), up from 2 500 in the week to 18Dec21.
4/Almost certainly in Gauteng, and perhaps nationally, excess natural deaths have started to fall. The p-score (deaths as a % above expected), nationally, fell slightly from 37.6% (week ending 25Dec21) to 36.2% (week ending 01Jan22). 


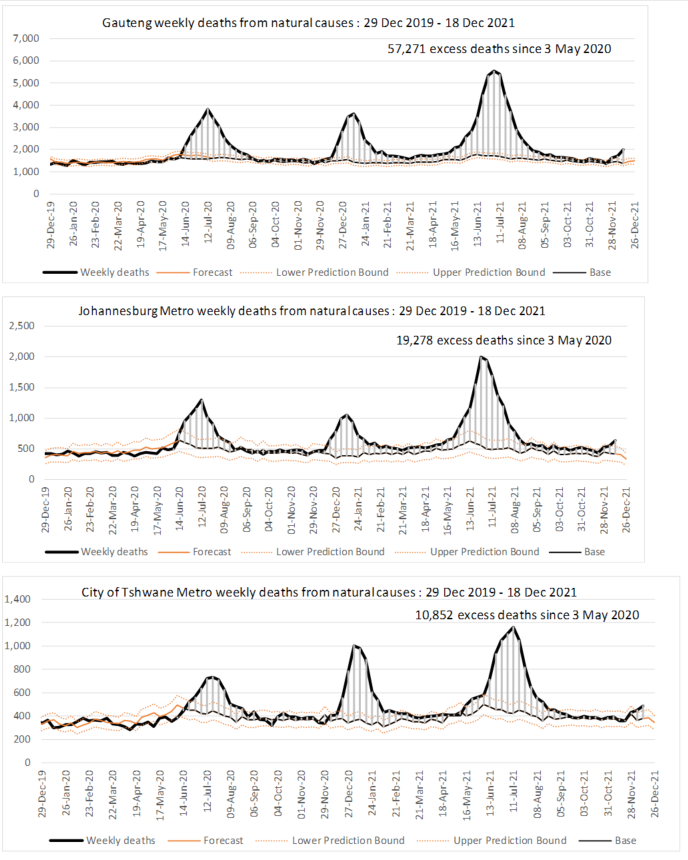
5/In Gauteng in the week to 01Jan22, the p-score was 7% (down from 42% in the week to 18Dec21, and 23% in the week to 25Dec21), and falling in each of the three metros. p-scores are still rising in EC (67%), KZN (47%), WC (40%) and NW (27%); falling elsewhere.

6/Your regular reminder that there are marked interprovincial differences in the level of reported Covid deaths relative to the excess natural deaths, even while the correlation between the two remains high.

7/By age, excess natural mortality fell at ages 70 and older, remaining more or less stable at ages 40-59.

8/Unnatural deaths remained very close to the predicted level. It is too early to identify an effect resulting from the relaxation of curfew and alcohol restrictions announced on 30Dec21, but based on past experience, these changes are likely to have negligible impact.

9/The most recent week marks the end of the 2021 ‘epiyear’. As noted in #2, we estimate around 201 000 excess natural deaths for the year, representing a p-score for the year of 45.5% (in other words, there were nearly half as many again natural deaths in 2021 than predicted).

10/The estimates for 2021 will still change as further deaths in 2021 are notified late to the authorities, and the adjustment for registrations in the most recent week unwinds itself.
11/By contrast, 2020 saw excess natural mortality of 19.4% (albeit with four months of almost no Covid deaths). Unnatural deaths in 2021 were 2.2% above expected, compared with the 12% lower than expected in 2020, reflecting the impact of hard lockdown on unnatural deaths.
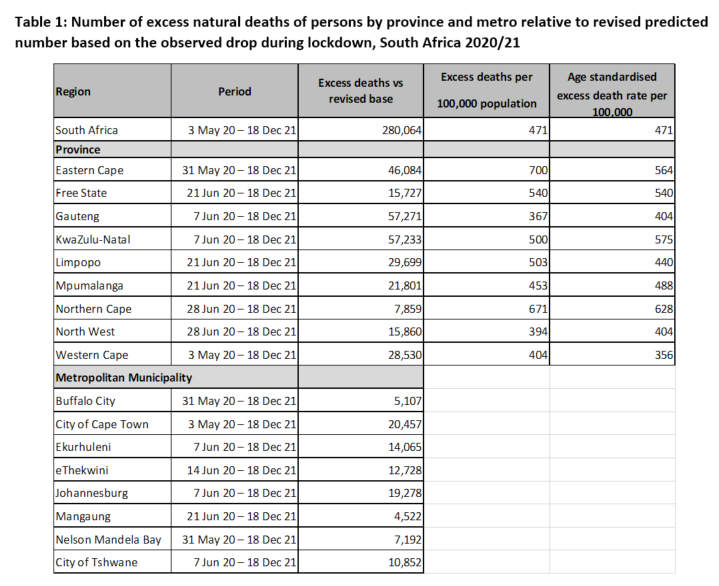
12/By province, with the singular exception of the Eastern Cape, excess mortality in 2021 exceeded that in 2020. Excess mortality in 2021 ranged from 34.7% in EC to 53.8% in Gauteng.
13/TESTING DATA THROUGH 01Jan22. The testing report is likely available tomorrow here: nicd.ac.za/diseases-a-z-i…
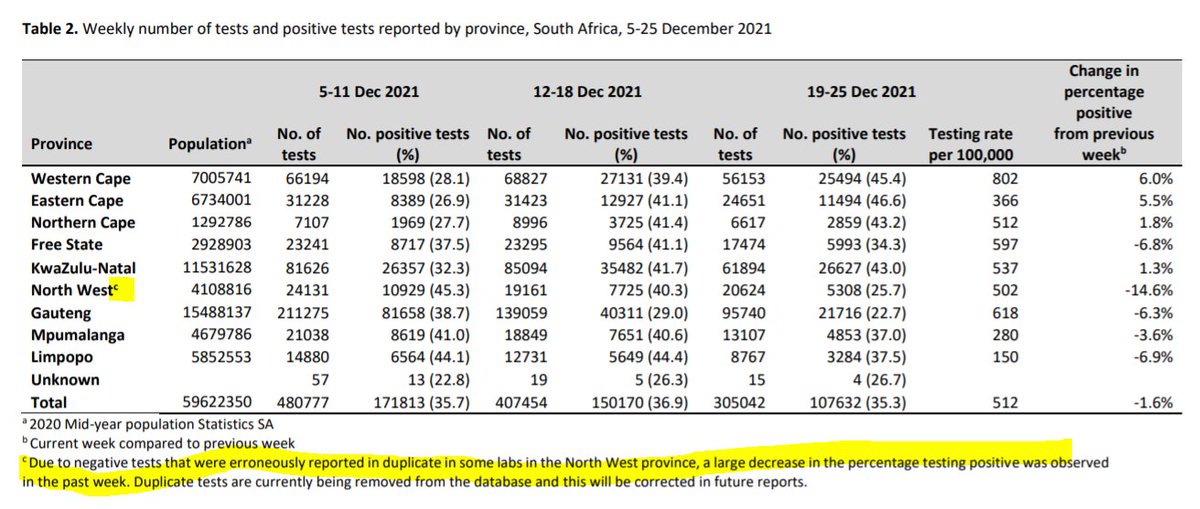
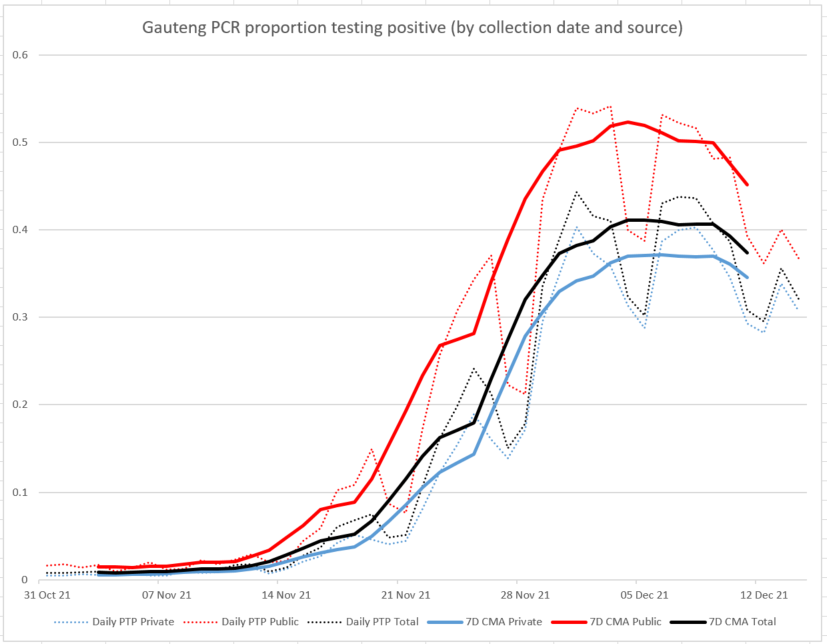
14/ The volume of tests fell noticeably over the festive season, but proportions testing positive decreased nationally from 35.2% to 31.1%. In Gauteng, the proportion testing positive fell below 20% for the first time since the week of 21-27Nov.


15/The APPEARANCE of an increase in PTP in NW province is an artifice of the data problems mentioned last week in that province, which have now been largely corrected (cf
https://twitter.com/tomtom_m/status/1476185612055162883).
16/Proportions testing positive by age show higher proportions at older ages – a change from the pattern over the last few months. (Also see #24).


17/At a district level, PTP exceeded 30% in 127 districts in the week to 01Jan22 (previous week, 186); and exceeded 20% in a further 46 districts (previous week, 34).

18/Putting this together. Some observations: A) The decoupling of deaths from cases in South Africa continues, as noted some weeks ago. The effect is visible in each province, whether presented as a correlation plot or as two (normalised) time plots.


19/That is undoubtedly (very) good news. And certainly, this wave (the red dots in the correlation plot in the previous tweet) look distinctly different to those from the previous wave.
20/BUT, the data on hospitalisations (this from sacmcepidemicexplorer.co.za) from the DatCov system show numbers of admissions that are lower than in previous waves, but not as dramatically as much as the deaths are lower.

21/An overburdening of SA hospitalisations was averted probably by a combination of 3 factors: reduced admissions; the generally shorter durations of admission among those admitted; and the inclusion of incidental Covid admissions among the count of Covid admissions.
22/However, health systems in other countries, experiencing a surge in cases (disclaimer: not my area of expertise!), with older, more vulnerable, or less protected populations, MAY still indeed come under strain, EVEN if deaths are significantly attenuated.
23/B) A further concern is that the pace of decline in proportions testing positive may be slower than it was on the way up. [The impact of the past NW data error is particularly evident in this plot]. This wave may prove more durable than originally thought.

24/C) The evolution of proportions testing positive by age group over the course of the Omicron wave is interesting – as noted at #16, PTP is now highest among those aged 50 and over.

25/But this would appear – largely – to be a temporal effect: normalising the PTP during this wave in each age group to its maximum, and applying different relative lags to the data, the evolution of PTP by age is essentially similar across the different age groups.

26/Final thought: the lighter mortality is clearly to be welcomed; but the scale of hospitalisation in South Africa suggests that there may still be burdens to be faced elsewhere; and the pace of the recent decline in PTP might be a cause for concern.
27/Stay well, and stay safe, wherever you may be.
• • •
Missing some Tweet in this thread? You can try to
force a refresh