Quick 1min scalp on $ETH (all publicly shared in Telegram - not as a sigal, but to show the principles we're learning together do work)
- Shared a trading plan
- Reassessed the Potential Trade, Entry Made
- New Trade Plan Shared
- Trade Managed Per Plan
- Conclusion
- Shared a trading plan
- Reassessed the Potential Trade, Entry Made
- New Trade Plan Shared
- Trade Managed Per Plan
- Conclusion
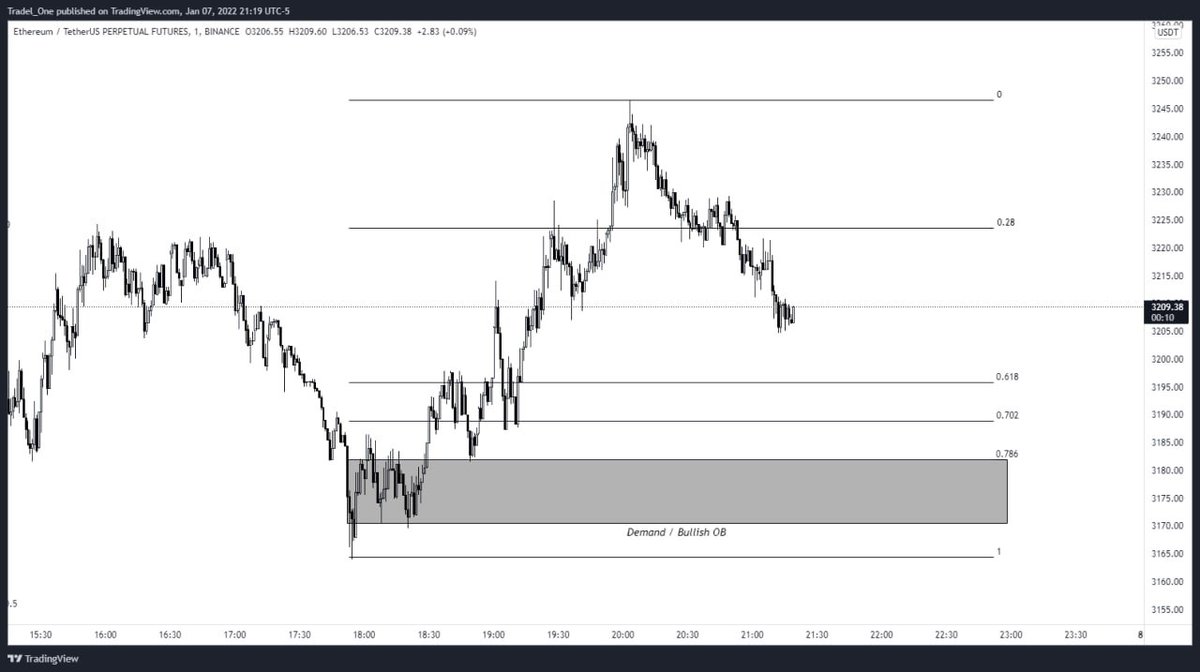
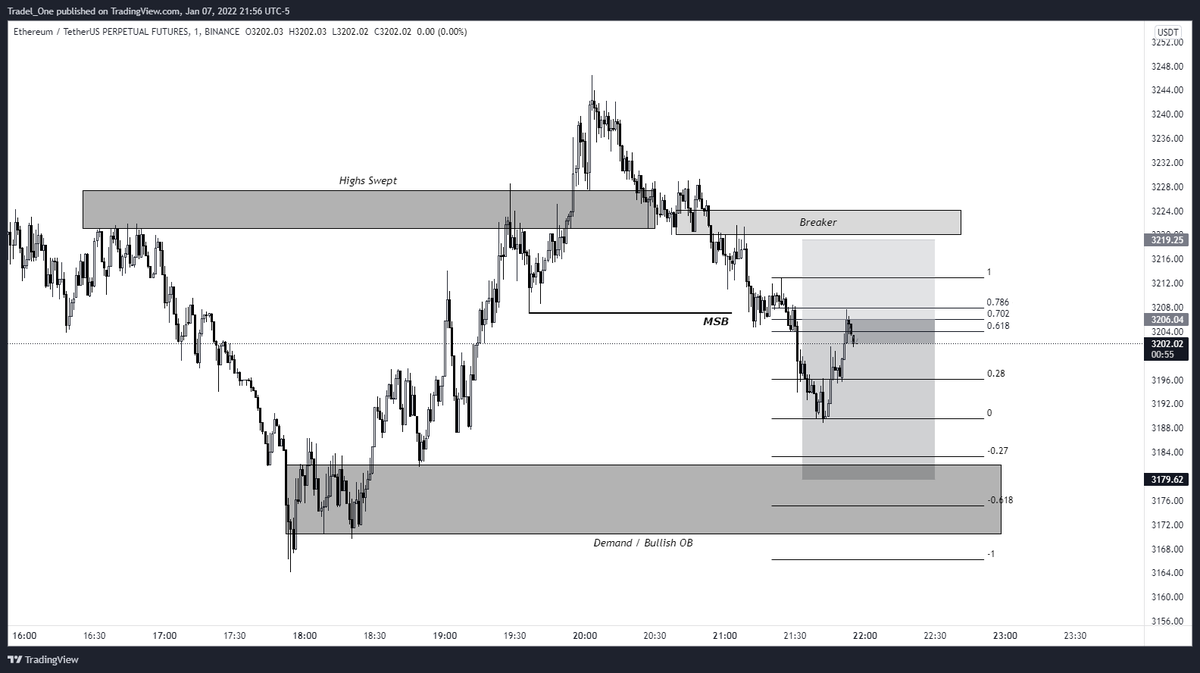
☑️Shared a Trading Plan
I thought that we might get an entry at a restest of an recent OB or breaker, as we were hovering on a Market Structure Break.
This didn't eventuate and the plan was invalidated dur to PA and MSB occuring
I thought that we might get an entry at a restest of an recent OB or breaker, as we were hovering on a Market Structure Break.
This didn't eventuate and the plan was invalidated dur to PA and MSB occuring
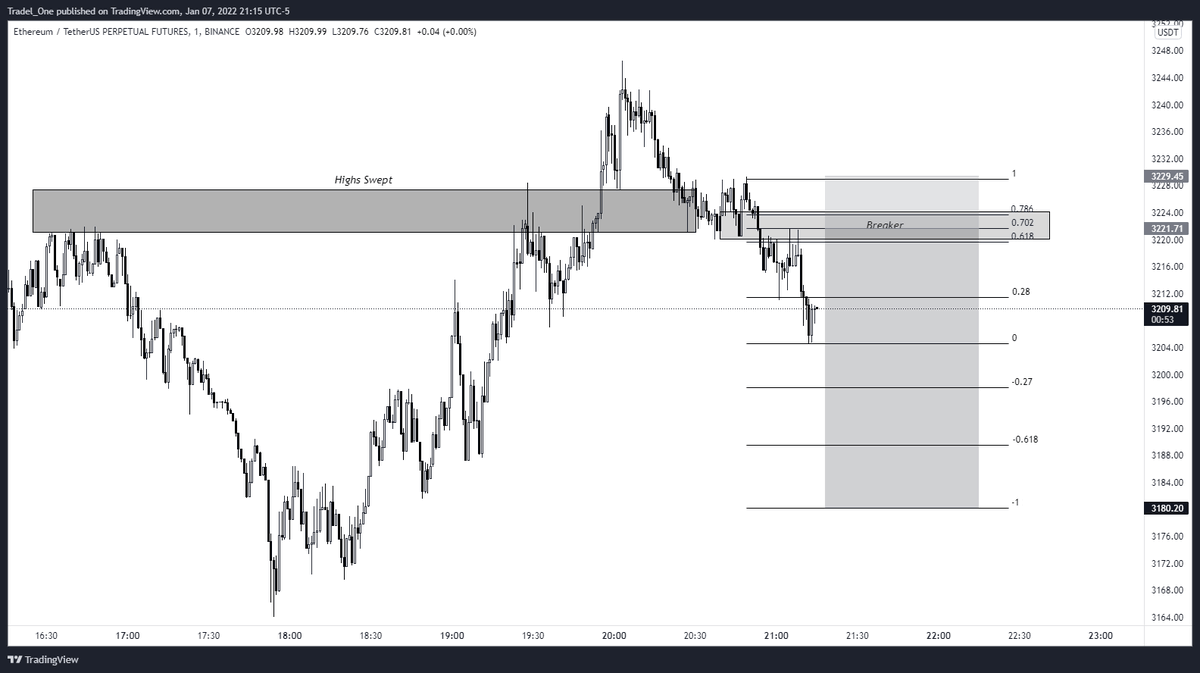
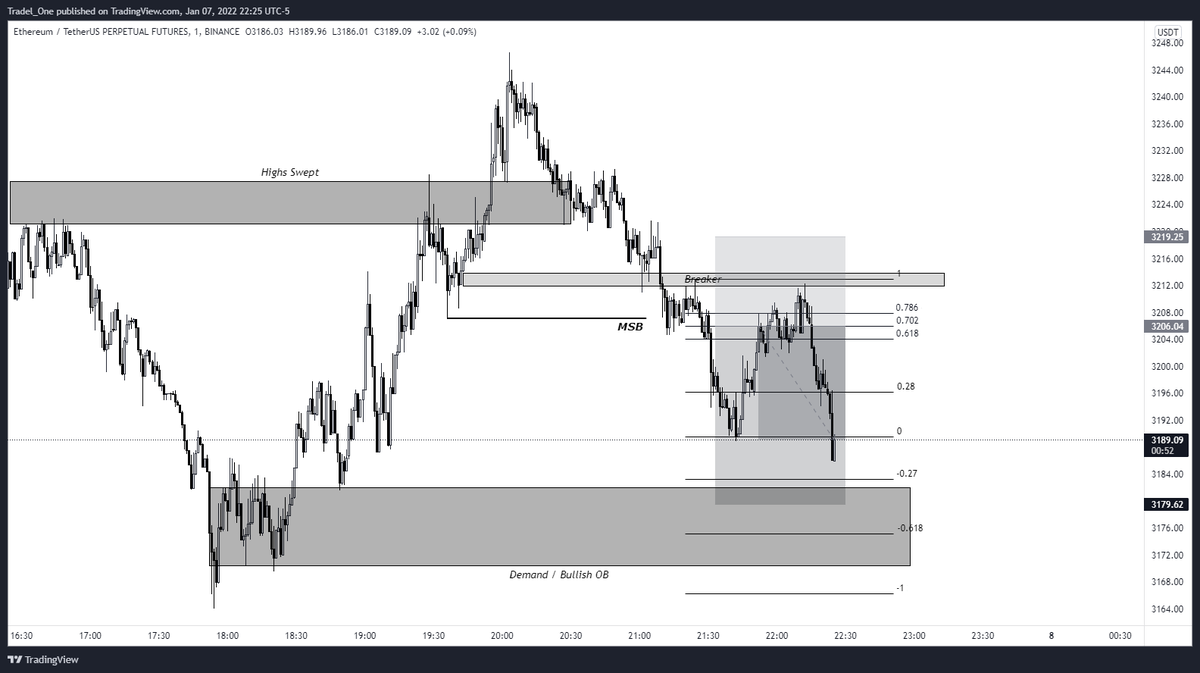
☑️ Reassessed Potential Trade, Entry Made
After seeing the MSB, I was looking for an entry at a bearish OB, or a breaker for entry
Here we see entry made at a restest of the MSB, which also saw a breaker in place that contributed to resistance
After seeing the MSB, I was looking for an entry at a bearish OB, or a breaker for entry
Here we see entry made at a restest of the MSB, which also saw a breaker in place that contributed to resistance
☑️New Trade Plan Shared
After the reassessment, I shared that I had set alerts at each planned TP level per the image below (and also SL to let me know that this trade sucked if it did - you can also give yourself shit as you do this in the alert message when it pings you!)
After the reassessment, I shared that I had set alerts at each planned TP level per the image below (and also SL to let me know that this trade sucked if it did - you can also give yourself shit as you do this in the alert message when it pings you!)

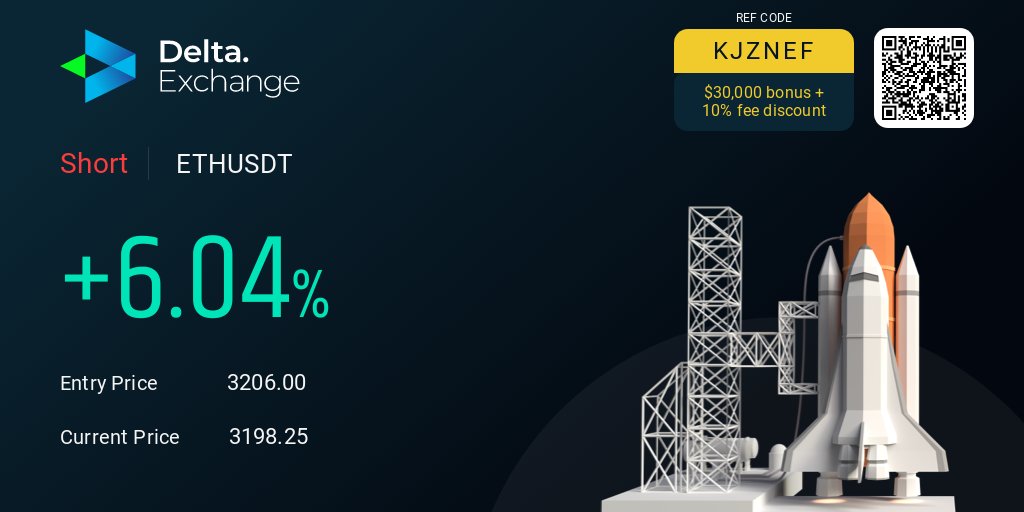
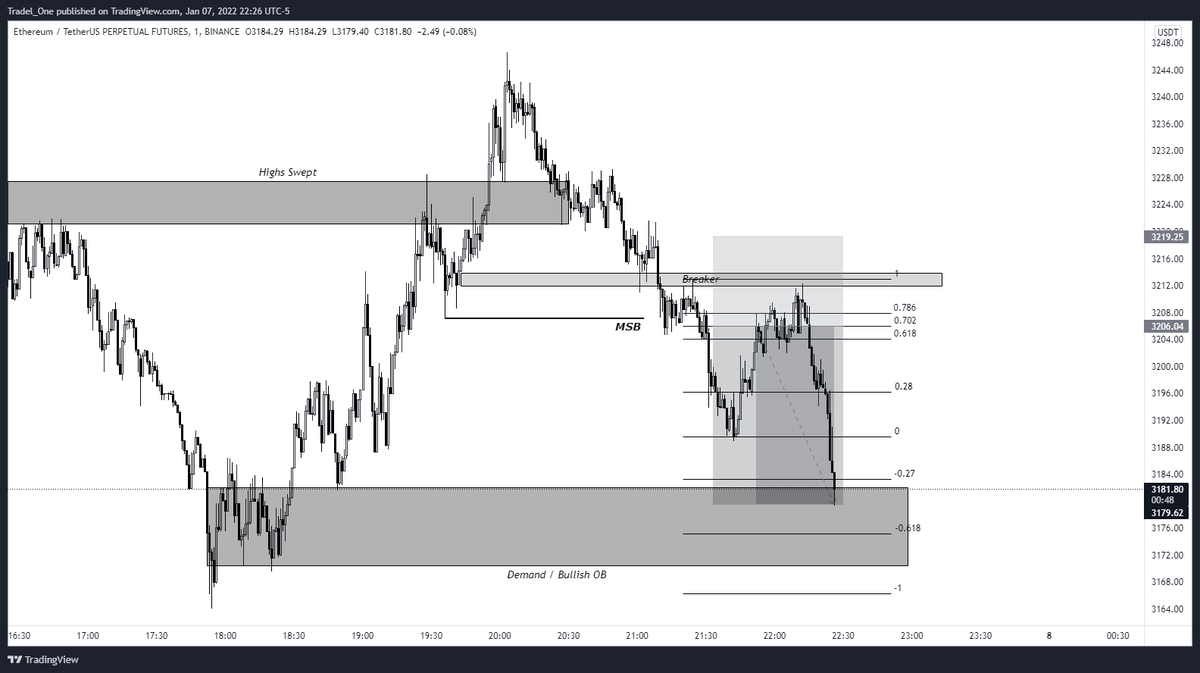
☑️Trade Managed Per Plan
TP 1 was hit
TP 2 hit
SL to BE
TP 3 hit
Final TP hit, trade closed
TP 1 was hit
TP 2 hit
SL to BE
TP 3 hit
Final TP hit, trade closed
☑️Conclusion
I'm sharing this to show that the principles from the course we're studying work, and that you can trade this way...you just need to keep showing up and having a go.
Note: I could have just been lucky on this trade, so you can't be a smart arse about these things!
I'm sharing this to show that the principles from the course we're studying work, and that you can trade this way...you just need to keep showing up and having a go.
Note: I could have just been lucky on this trade, so you can't be a smart arse about these things!
Thanks as always for your support - so many new audience members across several channels, and I really do appreciate your ongoing kind and lovely comments too.
Cheers guys, have a good weekend, and say hi to your mum for me
🤝🍻
Cheers guys, have a good weekend, and say hi to your mum for me
🤝🍻
• • •
Missing some Tweet in this thread? You can try to
force a refresh