Starting on 22 December, European gas prices experienced - shall we say - a bit of a "rug pull". Within 10 days they crashed by 60%. Is the gas crisis over?

Thread
1/n
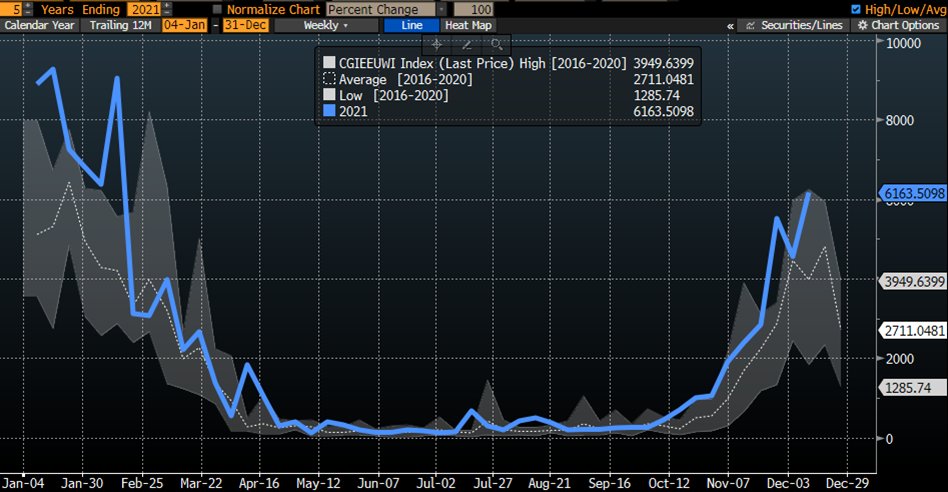
TTF (EU equ. of US price Henry Hub) crashed from a record $59/MMBtu down to $23/MMBtu within 10 days. Today, the price is back at $29 (left axis; $168/boe) or >7x (!) the price US consumers pay for their heating bill.

So no, the crisis is hardly "over". It gets worse.

2/n
Why did TTF (or it's UK equ. NBP) come crashing down in late December? Chiefly b/c Europe had an unusually warm weather patch. Warm weather meant less gas withdrawals.

3/n
High EU prices earlier in Dec H1 also meant a wide-open EU-Asia LNG arbitrage for US exports.

The new headline: "LNG flotilla" is heading to Europe. Narrative: Crisis solved. Well, not really. The "flotilla" couldn't move the EU gas market "dial".

4/n
Less gas withdrawals & more LNG importing was the recipe which crashed TTF from its "demand destruction levels". But did net EU injections of 3.5TWh for 2.5 days made a diffence?

5/n
Of course NOT. Overall EU gas storage fill is now at 55% (chart below) or where it was on 29 December 2021. The "flotilla" fixed 2-3 days of gas shortages, warmer weather another 4-5 days. Meanwhile, the EU remains 30 days "short gas", subject to weather!

6/n
Meanwhile, lower TTF prices stopped LNG shipments from the US into Europe. This is b/c the price arbitrage for shipments to Europe (as opposed to Asia) is now closed again. What hasn't changed however is Europe's need for more gas, urgently so.

7/n
Worse, high TTF prices forced some industrial output to be shut-in. After all, high commodity prices are supposed to do exactly that - reduce marginal consumption.

And now? Below seasonal consumption is roaring back up (chart: EU gas withdrawals (blue line) vs 8y-avg)

8/n
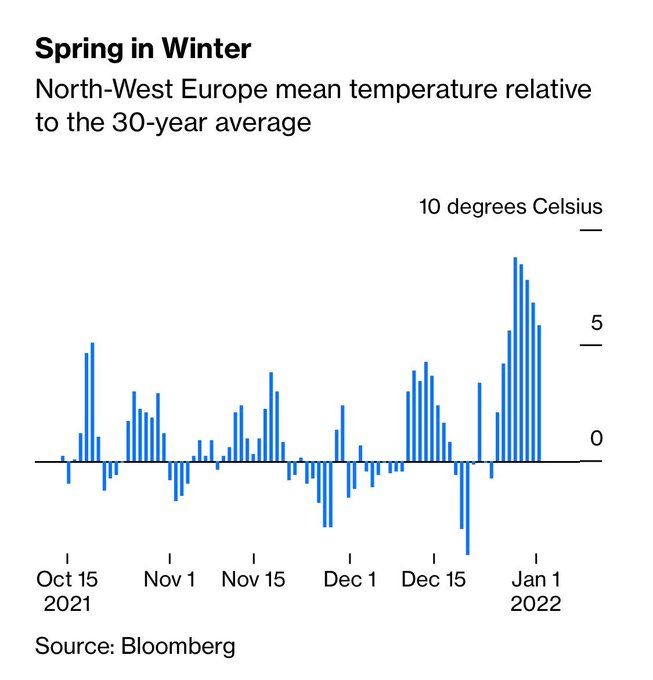
Consumption was already at record levels when compared to past 8y (as shown in chart above) as EU needs more gas for everything, but certainly for electricity generation. With a below-average cold temperature outlook (chart for 18 days; North-West EU), that will not change.

9/n
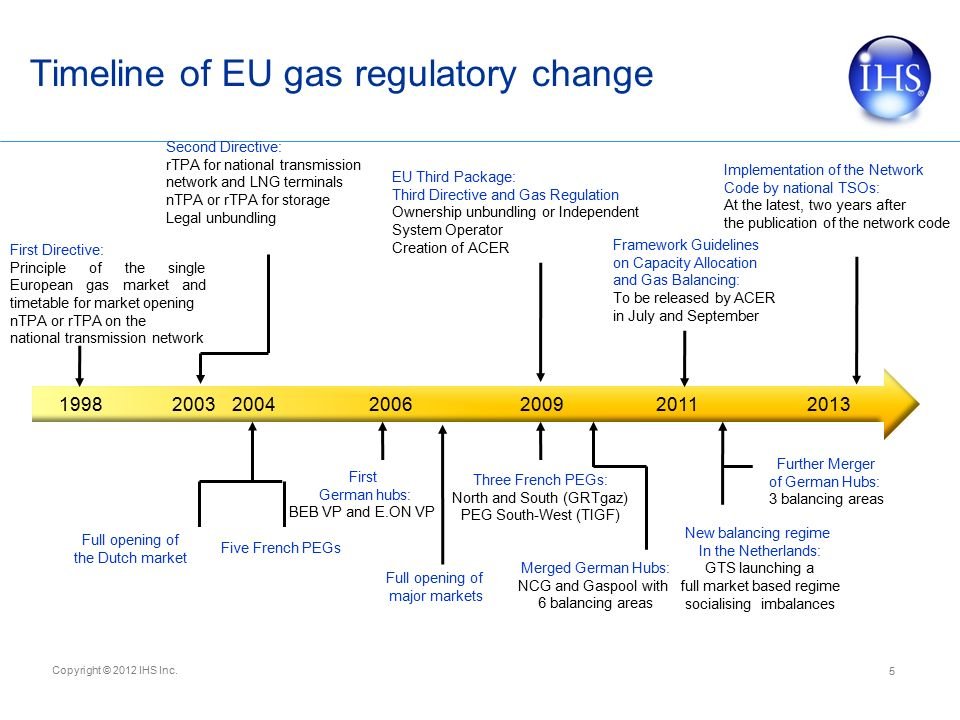
For more background on why Europe is in short supply of gas (the #hydrocarbon that provides power & heat) check this past thread. Upfront, the EU has structural supply issues, the alleviation of which need policy changes.

10/n @OlafScholz @vonderleyen
The Forward market however does not count on such policy changes. Instead it prices in a tighter EU gas market for years to come, as we illustrate below...

11/n
Finally, if somebody acuses you, @biancoresearch, that you are "clueless" or "if only media bothered to look at the numbers, it would have found out that #GAZPROM deliveries to EU are stable as a rock" - be careful b/c research is not their strength.

12/n @JavierBlas
To be clear, the EU gas crisis has many reasons. But of course, Gazprom is one reason. It delivered 38% LESS gas into the CEE pipeline system when compared to 2019 levels (pre-Covid consumption). That is 600TWh of gas missing (net of S2M)!

How did he say, clueless!

13/13

• • •

Missing some Tweet in this thread? You can try to force a refresh
 

Keep Current with Alexander Stahel

Alexander Stahel Profile picture

Stay in touch and get notified when new unrolls are available from this author!

Read all threads

This Thread may be Removed Anytime!

PDF

Twitter may remove this content at anytime! Save it as PDF for later use!

Try unrolling a thread yourself!

how to unroll video
  1. Follow @ThreadReaderApp to mention us!

  2. From a Twitter thread mention us with a keyword "unroll"
@threadreaderapp unroll

Practice here first or read more on our help page!

More from @BurggrabenH

9 Jan
The EU is in a gas crisis, the details of which we explained in various threads on this channel.

Ironically however, the liberalisation of the European gas markets is a huge success story. A brief history & some present day observations on gas security (#Gazprom).

Thread
1/n Image
With the liberalisation of EU gas & electricity markets in 1998, in theory consumers were able to freely choose their supplier & shop for the best deal. However, most households and businesses still lacked a real choice of supplier well into 2014. Why?

2/n
A Commission inquiry into the energy sector, published in February 2006, identified a number of "serious malfunctions" in the market as most countries maintained their local monopolies.

3/n
ec.europa.eu/competition/se…
Read 19 tweets
16 Dec 21
Copper - the metal that conducts electricity & heat best - is high in demand & short in supply.

Yet, the macro concern is all about China's property slowdown.

Let's give a go at that. Short thread
First, what is copper used (not "consumed", but "used" in durable goods & recycled thereafter) for?
Answer: for everything. But "building construction" is 28% of global copper use. Likely 50% of that is China construction related (hard to precise), say 4.1mtpa.

2/..
Of those 4.1mtpa however, a part is infrastructure construction related, which China does not slow down for now. Say, "building construction" related is 2-3mtpa - an unknown known.

3/..
Read 17 tweets
8 Dec 21
As the news that Kuwait may struggle to keep its oil output in the coming years, we like to explain some facts on "Base Declines". Kuwait is said to have 3.2mbpd capacity & produces 2.5mbpd in Oct 2021.
Kuwait is major, not minor for the market.

Thread
First, think of a conventional oil fields like a "normal distribution" or, after its mathematician, a "Gauss curve". As a field starts producing hydrocarbons, its production is stable or increases (with reservoir pressure & wells No) bf it enters in a "permanent decline".

2/... Image
Take the Cantarell offshore field in Mexico, one of a few "giant" conventional oil fields ever to be discovered. Do you see the "Gauss" curve below? In May 2021, Cantarell was down to 90kbpd, a fraction of its 2mbpd peak production in 2004.

3/... Image
Read 12 tweets
8 Dec 21
In Europe, US$ 200/boe hydrocarbon prices arrived as the EU gas hub price TTF is going vertical.

Note: €102/MWh = US$33.8/MMBtu (or $33.8/Mcf) = US$ 203/boe (barrel of oil equivalent)

Why?

1/4 @OKalleklev @NachoTrust Image
Because the EU continues to withdraw gas at a record pace when compared to its 5-year averages due to colder than average weather.

2/... Image
At the same time, the EU has lower than average gas injections for the time of the season.

3/... Image
Read 4 tweets
5 Dec 21
EU Covid data make a strong case for vaccines (among others), i.e Moderna, BionTech / Pfizer, AstraZeneca and J&J.

Short thread.
EU is 69% vaccinated, starting mid January 2021.
648m doses were adminstrated, 308m vaccinations completed on a total population of 447m.
It had 3 waves, with 9.4% death in first, 1.83% in 2nd & 0.84% death in percentage of Covid-19 cases in the current wave.

2/...
Take Germany with a population of 83m, Europe's largest. It currently goes through a record Delta case wave (Omicron only just arrived), but so far it only had 0.48% death on 2.4m cases in 3rd wave. How was this for the first two waves?

3/...Source: Bloomberg
Read 9 tweets
5 Dec 21
Ran Balicer, head of Israel’s national Covid committee, says he had “no clue” where early estimates of Covid vaccine efficacy, published in Israeli media, had come from. “I would suggest everyone just holds tight and wait,” he says.

#omicron on.ft.com/3EsqQJ0
25% likely to be reinfected Image
Waves much steeper / quicker as Delta Image
Read 5 tweets

Did Thread Reader help you today?

Support us! We are indie developers!


This site is made by just two indie developers on a laptop doing marketing, support and development! Read more about the story.

Become a Premium Member ($3/month or $30/year) and get exclusive features!

Become Premium

Too expensive? Make a small donation by buying us coffee ($5) or help with server cost ($10)

Donate via Paypal

Or Donate anonymously using crypto!

Ethereum

0xfe58350B80634f60Fa6Dc149a72b4DFbc17D341E copy

Bitcoin

3ATGMxNzCUFzxpMCHL5sWSt4DVtS8UqXpi copy

Thank you for your support!

Follow Us on Twitter!

:(