In Europe, US$ 200/boe hydrocarbon prices arrived as the EU gas hub price TTF is going vertical.

Note: €102/MWh = US$33.8/MMBtu (or $33.8/Mcf) = US$ 203/boe (barrel of oil equivalent)

Why?

1/4 @OKalleklev @NachoTrust Image
Because the EU continues to withdraw gas at a record pace when compared to its 5-year averages due to colder than average weather.

2/... Image
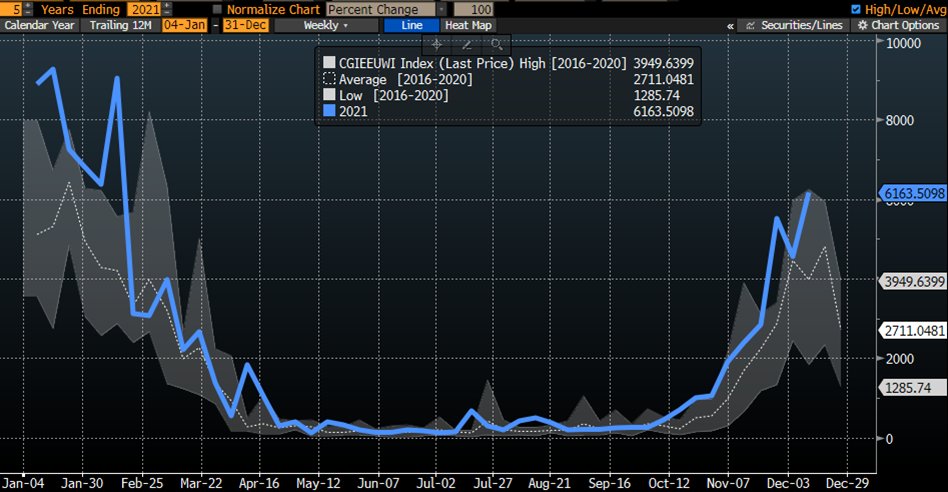
At the same time, the EU has lower than average gas injections for the time of the season.

3/... Image
All this on the back of very low gas storage levels as the winter months are ahead.

If we want to learn more why EU energy security increasingly becomes a prayer, not a policy, please read the thread below.

4/4

• • •

Missing some Tweet in this thread? You can try to force a refresh
 

Keep Current with Alexander Stahel

Alexander Stahel Profile picture

Stay in touch and get notified when new unrolls are available from this author!

Read all threads

This Thread may be Removed Anytime!

PDF

Twitter may remove this content at anytime! Save it as PDF for later use!

Try unrolling a thread yourself!

how to unroll video
  1. Follow @ThreadReaderApp to mention us!

  2. From a Twitter thread mention us with a keyword "unroll"
@threadreaderapp unroll

Practice here first or read more on our help page!

More from @BurggrabenH

8 Dec
As the news that Kuwait may struggle to keep its oil output in the coming years, we like to explain some facts on "Base Declines". Kuwait is said to have 3.2mbpd capacity & produces 2.5mbpd in Oct 2021.
Kuwait is major, not minor for the market.

Thread
First, think of a conventional oil fields like a "normal distribution" or, after its mathematician, a "Gauss curve". As a field starts producing hydrocarbons, its production is stable or increases (with reservoir pressure & wells No) bf it enters in a "permanent decline".

2/... Image
Take the Cantarell offshore field in Mexico, one of a few "giant" conventional oil fields ever to be discovered. Do you see the "Gauss" curve below? In May 2021, Cantarell was down to 90kbpd, a fraction of its 2mbpd peak production in 2004.

3/... Image
Read 12 tweets
5 Dec
EU Covid data make a strong case for vaccines (among others), i.e Moderna, BionTech / Pfizer, AstraZeneca and J&J.

Short thread.
EU is 69% vaccinated, starting mid January 2021.
648m doses were adminstrated, 308m vaccinations completed on a total population of 447m.
It had 3 waves, with 9.4% death in first, 1.83% in 2nd & 0.84% death in percentage of Covid-19 cases in the current wave.

2/...
Take Germany with a population of 83m, Europe's largest. It currently goes through a record Delta case wave (Omicron only just arrived), but so far it only had 0.48% death on 2.4m cases in 3rd wave. How was this for the first two waves?

3/...Source: Bloomberg
Read 9 tweets
5 Dec
Ran Balicer, head of Israel’s national Covid committee, says he had “no clue” where early estimates of Covid vaccine efficacy, published in Israeli media, had come from. “I would suggest everyone just holds tight and wait,” he says.

#omicron on.ft.com/3EsqQJ0
25% likely to be reinfected Image
Waves much steeper / quicker as Delta Image
Read 5 tweets
3 Dec
Let us look at US crude & product inventories. It remains the largest refining system globally & by far & away the most transparent market which is why US inventory data matter for crude oil prices globally (although less so now than in times pre-global satellite data).

#OOTT
All-in, US crude & product inventories incl. SPR are 35Mb below their 10-year average at 1,825mb (blue line). They are 100Mb, give or take, away from hitting a decade low. With 50Mb SPR release, we may get their in Q1 2022 and subject to Omicron effects.

2/.. Image
The same data in a 5-year average scenario? We're already 125mb below its 5-average. Kind of interesting. Mind you - commodities price at the margin. So this is an interesting combo with WTI at $68/bbl (ex Macro Set-up).

3/.. Image
Read 17 tweets
24 Nov
What is the Status Quo of the EU gas crisis?

A short thread in charts on why we are here & where the EU gas crisis is aheading next.

Summary: EU gas security is a prayer, not a policy!

1/...
As of today, EU gas storage tanks are 72% filled. This is WELL below its 5-year averages.

2/...
Expressed in Terra Watt Hours (TWh), the EU has 809 TWh of storage as at 21 November 2021.

For perspective: In the winter 2017/18, the EU consumed 770 TWh from 1 Nov 2017 - 31 March 2018.
Gas storage couldn't go that low bc pipeline systems needs to stay under pressure.

3/...
Read 22 tweets
5 Nov
High European gas prices has many reasons but one factor seems to be Gazprom's low storage fill in Europe. Is that really true? Let us look at the facts of @Gazprom's storage situation in Europe. 1/...

#EU #NaturalGas
Friendly reminder: The EU imports 33% of its natural gas consumption from Russia, i.e. Gazprom! So if gas is short in Europe, Gazprom does matter. 2/...
So can we measure the storage percentage fill of Gazprom? Yes, once we identified its locations. Specifically, they are Rehden, Etzel, Jemgum, Katharina in Germany, Haidach in Austria, Bergermeer in NL, Damborice in Czech & Banatski Dvor in Serbia. 3/..

Source: Gazprom
Read 12 tweets

Did Thread Reader help you today?

Support us! We are indie developers!


This site is made by just two indie developers on a laptop doing marketing, support and development! Read more about the story.

Become a Premium Member ($3/month or $30/year) and get exclusive features!

Become Premium

Too expensive? Make a small donation by buying us coffee ($5) or help with server cost ($10)

Donate via Paypal

Or Donate anonymously using crypto!

Ethereum

0xfe58350B80634f60Fa6Dc149a72b4DFbc17D341E copy

Bitcoin

3ATGMxNzCUFzxpMCHL5sWSt4DVtS8UqXpi copy

Thank you for your support!

Follow Us on Twitter!

:(