Thread 1/5: After seeing such a clean rejection off of the 30m OR (opening range) for #NQ_F on Friday, I thought of @Michigandolf, who loves the 30m OR. I then wondered how often we close below or above the 30m OR. I decided to do the math so you don’t have to.
Although #ES_F did not reject the 30m OR like NQ on Friday, it did reject the open. You can see the highlighted area around open is the 30 second OR, popularized by @paxtrader777 and shared by a few others. My favorite opening range on my chart.
I was surprised, I would have guessed we closed outside of the 30m OR ~50% of the time or less, but actually we close outside of the 30m OR 73% of the time. NQ even closes outside of the 60m OR more times than it closes inside.
ES is less likely to close outside of the OR than NQ, but still shows we close outside more than we do inside. I was reminded of those famous words from @ES_F_Leo, if B is inside of A.. well, if B is inside of A, ES still closes outside of the 30m OR 61.9% (26/42) of the time...
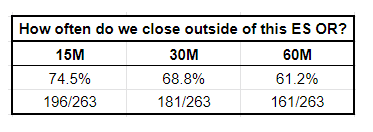
... which is less than if B is not inside of A, but this was only 42 instances in the last 263 trading days.

I thought this information was at least somewhat useful so I decided to share it.

Start date for data: 1/4/2021, end date: 1/7/2022.

• • •

Missing some Tweet in this thread? You can try to force a refresh
 

Keep Current with Alec

Alec Profile picture

Stay in touch and get notified when new unrolls are available from this author!

Read all threads

This Thread may be Removed Anytime!

PDF

Twitter may remove this content at anytime! Save it as PDF for later use!

Try unrolling a thread yourself!

how to unroll video
  1. Follow @ThreadReaderApp to mention us!

  2. From a Twitter thread mention us with a keyword "unroll"
@threadreaderapp unroll

Practice here first or read more on our help page!

More from @TheFakeAlec

12 Dec 21
1/x
Wow, my first thread.
Analyzing the NQZ21 contract, I looked at 9/2 to 12/10 and at various opening ranges (OR), gap fills and overnight high/low. I only looked at the last 72 days. I downloaded data from Sierra chart and analyzed it in excel. #NQ_F #NQ
2/x
I did use NQ close data from Yahoo finance because the previous close line on SC was being stubborn and not giving me correct data (probably my fault). There’s a bunch of numbers and percentages, you can scroll to the end if you’d like, or ignore it. idc.
3/x
30m OR L =LOD 38.9% (28/72)
30m OR H =HOD 31.9% or (23/72)
So 70.8% (51/72) of the time, the 30 min OR puts in HOD or LOD.
Which means both sides are broken 29.2% (21/72) because the 30m OR did not put in both the HOD and LOD at any point.
Read 12 tweets

Did Thread Reader help you today?

Support us! We are indie developers!


This site is made by just two indie developers on a laptop doing marketing, support and development! Read more about the story.

Become a Premium Member ($3/month or $30/year) and get exclusive features!

Become Premium

Too expensive? Make a small donation by buying us coffee ($5) or help with server cost ($10)

Donate via Paypal

Or Donate anonymously using crypto!

Ethereum

0xfe58350B80634f60Fa6Dc149a72b4DFbc17D341E copy

Bitcoin

3ATGMxNzCUFzxpMCHL5sWSt4DVtS8UqXpi copy

Thank you for your support!

Follow Us on Twitter!

:(