
New preprint: Ct value trajectories from 97 Omicron infections detected in the @NBA testing cohort: dash.harvard.edu/handle/1/37370…
1) High % had Ct<30 at day 5 post detection
2) Omicron had lower peak viral load and more variable early viral growth durations than Delta
1/13
1) High % had Ct<30 at day 5 post detection
2) Omicron had lower peak viral load and more variable early viral growth durations than Delta
1/13
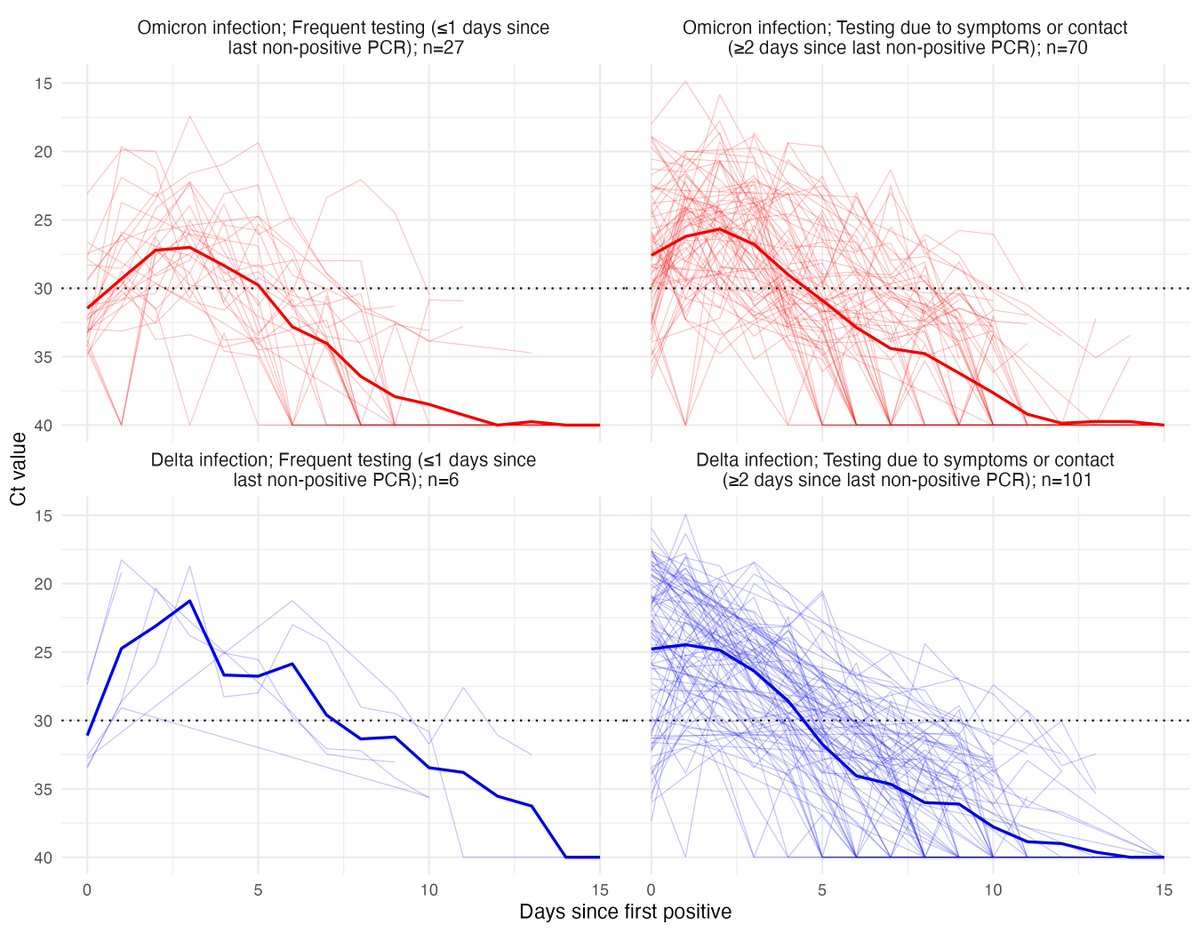
We obtained longitudinal RT-qPCR tests (a combined anterior nares & oropharyngeal swab in each person) collected between July 5th 2021 and January 10th 2022 from the NBA occupational health program. This included 97 Omicron infections and 107 confirmed Delta infections. 2/13
Here are trajectories from individuals detected ≤1 day or ≥2 days since a previous negative or inconclusive test. The latter group reflects identification due to symptoms or concern for contact with an infected individual. Data here: github.com/gradlab/CtTraj… 3/13 
We looked at the % of individuals with Ct<30 on each day post detection, noting Ct<30 is a useful but caveated proxy for LFT sensitivity and culturable virus. We saw:
1) ~50% of individuals have Ct<30 on day 5 post detection
2) All individuals have Ct≥30 by day 11
4/13
1) ~50% of individuals have Ct<30 on day 5 post detection
2) All individuals have Ct≥30 by day 11
4/13
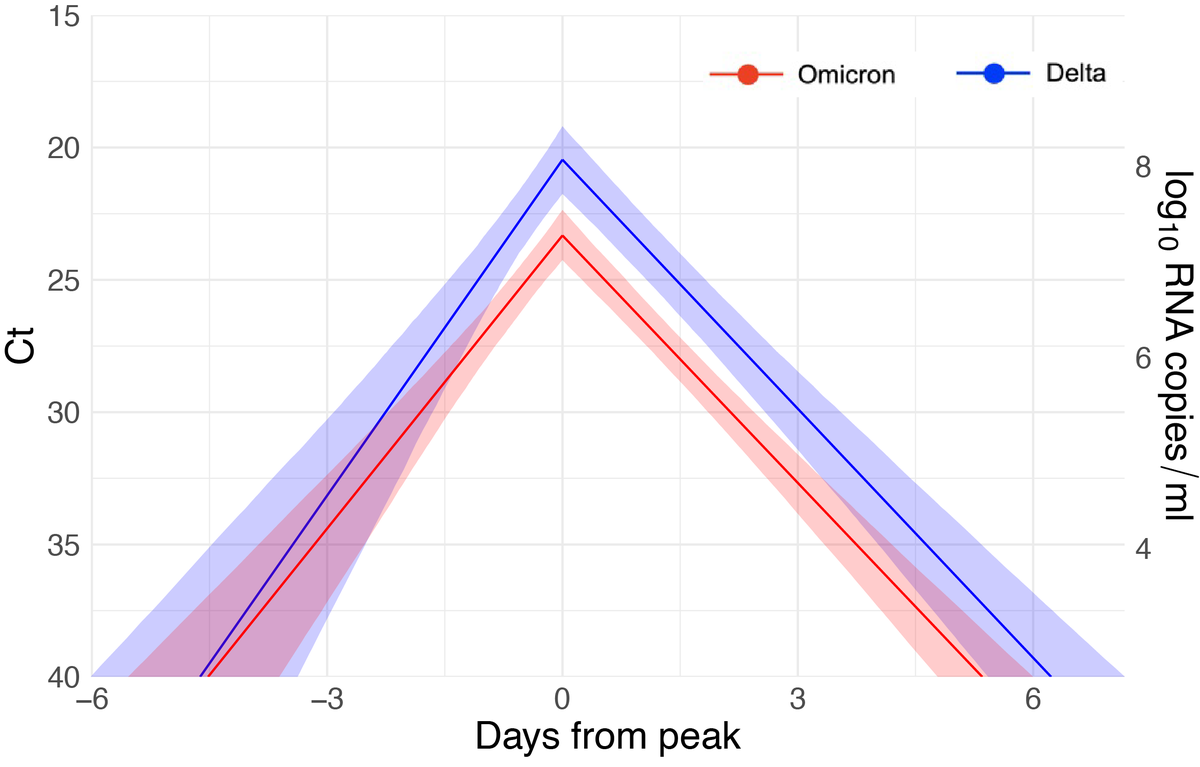
Next, building on our prior work (tinyurl.com/2szh8368, tinyurl.com/2p82efyz), we quantified the viral dynamics. Omicron infection duration was similar to Delta (both ~10 days), but Omicron infections had lower peak viral loads (higher peak Ct values). 5/13
We also saw more variability in estimated proliferation times – that is the delay from infection to reaching peak Ct. Plot shows individual-level posterior mean estimates (Omicron in red, Delta in blue). 6/13
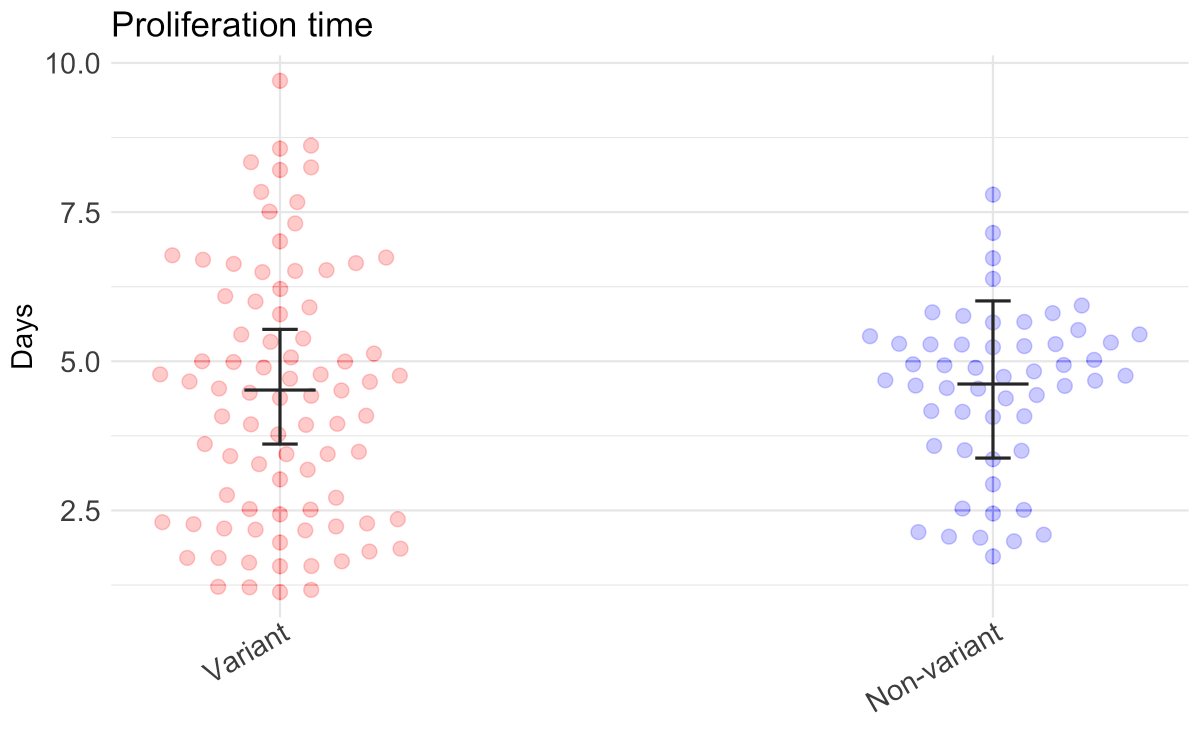
This seems consistent with anecdata finding some Omicron infections with low viral load for a few days prior to growth, possibly reflecting suppression via immunity or different compartmentalization in the respiratory tract, while others grow rapidly.
7/13
7/13
Pre-empting a key question: “what’s the impact of immunity?”. Probably a fair bit, as most of these individuals are vaccinated and many were boosted before the rise of Omicron. We are working to update these analyses accounting for immune status. 8/13
Key limitations:
1) Ct<30 threshold is a proxy and does not necessarily predict infectiousness.
2) These infections are likely identified faster than in the general population, so “day 5 post detection” in other contexts may reflect a later point in infection than day 5 here
9/13
1) Ct<30 threshold is a proxy and does not necessarily predict infectiousness.
2) These infections are likely identified faster than in the general population, so “day 5 post detection” in other contexts may reflect a later point in infection than day 5 here
9/13
Take home 1: ~50% of individuals have low Cts ≥5 days post detection, even in this highly-boosted population (see also tinyurl.com/2p8858jt). A cautious approach to shortening isolation may therefore be warranted, noting that the decision balances multiple factors. 10/13
Take home 2: Peak viral load, proxied by Ct values, is lower, and peaks no sooner, than for Omicron than Delta. So Omicron’s increased infectiousness doesn’t seem to be through higher viral load (at least as measured in the nose and mouth by Ct values). 11/13
This is a preprint and hasn’t been peer reviewed. We welcome feedback! See related (and many other threads):
12/13
https://twitter.com/CT_Bergstrom/status/1479938654579544065
https://twitter.com/EckerleIsabella/status/1481041567817388037
https://twitter.com/seabbs/status/1479758238828711936
12/13
This work is the product of a collaboration with a great team across institutions: @StephenKissler @yhgrad @HarvardChanSPH @cdefilippomack @IQVIA_US @JosephFauver @NathanGrubaugh @YaleSPH and @TempusLabs @NBA @TheNBPA among others. 13/13
I missed out a key figure from this thread, but @NathanGrubaugh has included and summarized it here:
https://twitter.com/NathanGrubaugh/status/1481760067447832577
Preprint now up on medrxiv: medrxiv.org/content/10.110…
• • •
Missing some Tweet in this thread? You can try to
force a refresh


