The Secrets Traders Don’t Want You To Know.
(thread)👇🏽
(thread)👇🏽

• Glossary
Bull (ish) = Price is rising
Bear (ish) = Price is falling
Bull (ish) = Price is rising
Bear (ish) = Price is falling

• Chart Types
- Candlestick
- Line
- Bar
There are more,
but these 3 are common.
We’ll be focusing on candlesticks in this thread, as it is the most important and the easiest one to trade.
- Candlestick
- Line
- Bar
There are more,
but these 3 are common.
We’ll be focusing on candlesticks in this thread, as it is the most important and the easiest one to trade.

• Candlesticks Explained
Stock Price movements consist of the following:
• Opening Price
• Closing Price
• High of the day
• Low of Day
Stock Price movements consist of the following:
• Opening Price
• Closing Price
• High of the day
• Low of Day


Now that we know how to identify the opening, closing, high and low parts on a candlestick.
We must also learn about
- Upper shadow
- Real Body
- Lower shadow
Look at the diagrams below 👇🏽
We must also learn about
- Upper shadow
- Real Body
- Lower shadow
Look at the diagrams below 👇🏽


Candlestick charts build patterns that predict price direction once completed.
Let’s check a few of them out 👇🏽
Let’s check a few of them out 👇🏽
• 8 most know candlestick patterns
1. Doji Star
2. Morning Star
3. Evening star
4. Bullish Engulfing Candle
5. Rising Three Method Pattern
6. Bullish hammer
7. Inverted hammer
8. Shooting star
1. Doji Star
2. Morning Star
3. Evening star
4. Bullish Engulfing Candle
5. Rising Three Method Pattern
6. Bullish hammer
7. Inverted hammer
8. Shooting star
1/
Doji Star
It is when the opening and closing price of a security is almost the same. (Small real body)
It signals a potential reversal of a downtrend
(+ vice versa in a bullish trend ) 👇🏽
(It’s the candle stick in the middle)
Bullish Bearish
Doji Star
It is when the opening and closing price of a security is almost the same. (Small real body)
It signals a potential reversal of a downtrend
(+ vice versa in a bullish trend ) 👇🏽
(It’s the candle stick in the middle)
Bullish Bearish

2/
Morning star
Is a bullish 3 candle pattern which is formed at the bottom of a move down.
Once you spot a doji, you wait for the 2nd green candle to give confirmation that it’s turning bullish, then you go long.
You set your stop loss at the previous red candles close.
Morning star
Is a bullish 3 candle pattern which is formed at the bottom of a move down.
Once you spot a doji, you wait for the 2nd green candle to give confirmation that it’s turning bullish, then you go long.
You set your stop loss at the previous red candles close.


3/
Evening star
It’s the opposite of a morning star. It’s a bearish 3 candle pattern which is formed on the top of a move up.
Once you spot a doji in an uptrend, you wait for the second red candle and go short.
Evening star
It’s the opposite of a morning star. It’s a bearish 3 candle pattern which is formed on the top of a move up.
Once you spot a doji in an uptrend, you wait for the second red candle and go short.

4/
Bullish Engulfing pattern
It opens lower than the previous days close, and then closes higher than the previous days open.
(+ vice versa for bearish )
A bullish reversal is more likely if the bearish trend is oversold. But can’t be reliant just on its own
Looks like this👇🏽
Bullish Engulfing pattern
It opens lower than the previous days close, and then closes higher than the previous days open.
(+ vice versa for bearish )
A bullish reversal is more likely if the bearish trend is oversold. But can’t be reliant just on its own
Looks like this👇🏽


5/
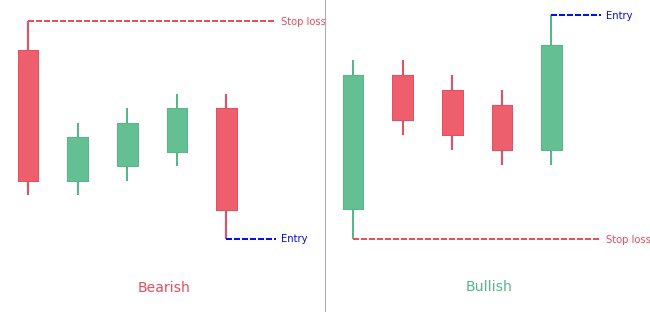
Rising Three Methods Pattern
The bulls are in control before pausing to see if there is enough conviction in the uptrend.
The red candles are considered consolidation before moving up again in an existing uptrend.
Sellers have no control.
Bullish set up 👇🏽
Rising Three Methods Pattern
The bulls are in control before pausing to see if there is enough conviction in the uptrend.
The red candles are considered consolidation before moving up again in an existing uptrend.
Sellers have no control.
Bullish set up 👇🏽

Bearish setup👇🏽
characterized by two long candlesticks in the direction of the trend, one at the beginning and end, with three shorter counter-trend candlesticks in the middle
This pattern shows traders that the bulls still don't have sufficient conviction to reverse the trend
characterized by two long candlesticks in the direction of the trend, one at the beginning and end, with three shorter counter-trend candlesticks in the middle
This pattern shows traders that the bulls still don't have sufficient conviction to reverse the trend
6/
Bullish Hammer
Hammer candlesticks typically occur after a price decline. They have a small real body and a long lower shadow
The lower shadow should be at least two times the height of the real body.
The price must start moving up following the hammer to confirm upside.
Bullish Hammer
Hammer candlesticks typically occur after a price decline. They have a small real body and a long lower shadow
The lower shadow should be at least two times the height of the real body.
The price must start moving up following the hammer to confirm upside.

7/
Inverted Hammer
This is a bullish reversal pattern, it signals that a stock is nearing the bottom in a down trend.
The inverted hammer looks like an upside down version of the hammer candlestick pattern (above).
When it appears in an uptrend it is called a shooting star.
Inverted Hammer
This is a bullish reversal pattern, it signals that a stock is nearing the bottom in a down trend.
The inverted hammer looks like an upside down version of the hammer candlestick pattern (above).
When it appears in an uptrend it is called a shooting star.

8/
Shooting star
On the right side of the image is a shooting star pattern, it is the opposite of an inverted hammer.
It presents itself in an uptrend and usually precedes falling prices.
Shooting star
On the right side of the image is a shooting star pattern, it is the opposite of an inverted hammer.
It presents itself in an uptrend and usually precedes falling prices.

That’s it for now, if you want to be a better trader then follow @talkcentss for more trading education.
You can expect more:
• Trading secrets
• Finance Education
• Stock Research
• Price analysis
• Market updates
You can expect more:
• Trading secrets
• Finance Education
• Stock Research
• Price analysis
• Market updates
• • •
Missing some Tweet in this thread? You can try to
force a refresh