Mike Simonsen ๐Ÿ‰ Profile picture
Jan 24 โ€ข 8 tweets โ€ข 3 min read
Volatility in stock and crypto markets not enough to slow housing (yet). Here's what we can see in the data - this week's @altosresearch ๐Ÿ“ฝ๏ธ๐Ÿงต๐Ÿ‘‡

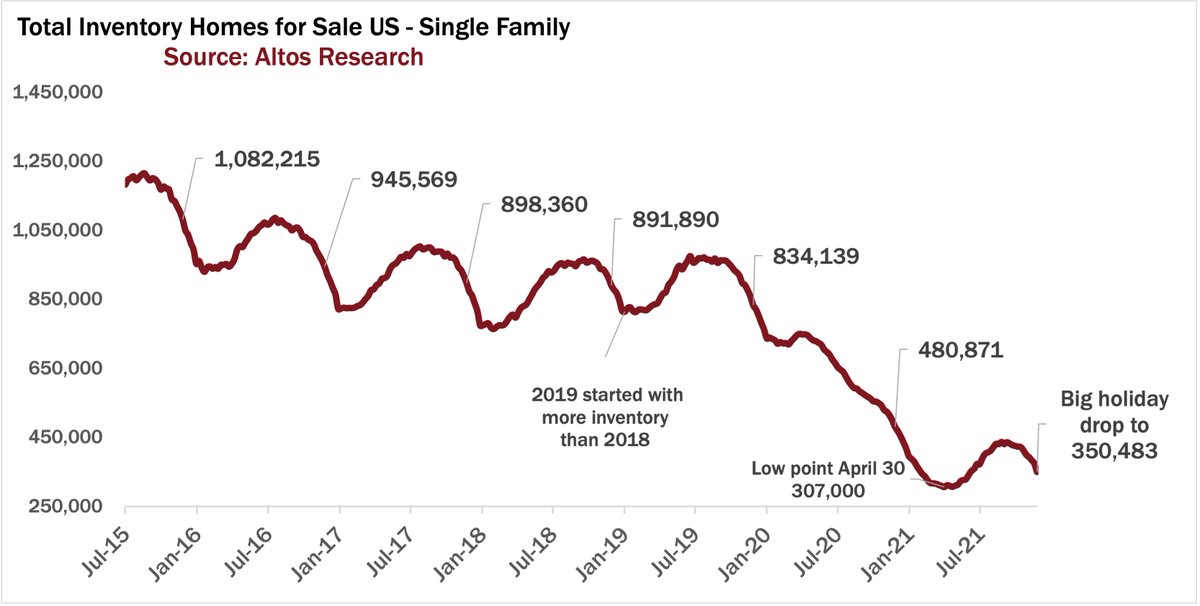
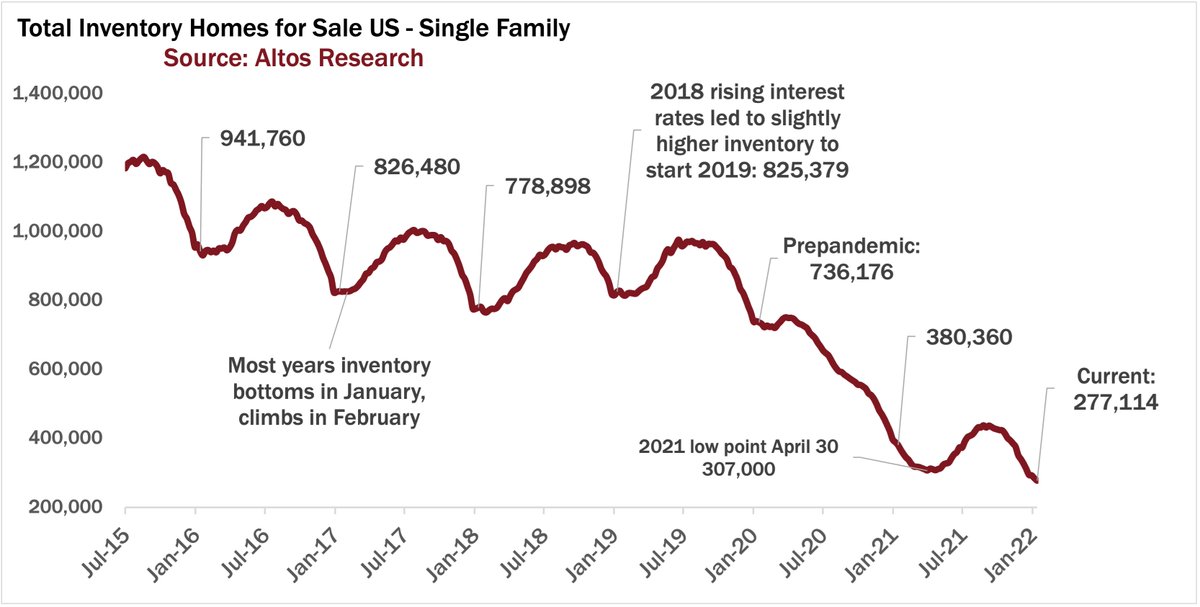
Available inventory of unsold single family homes fell by 2.4% this week to only 277,000 homes on the market. New record low.

1/7
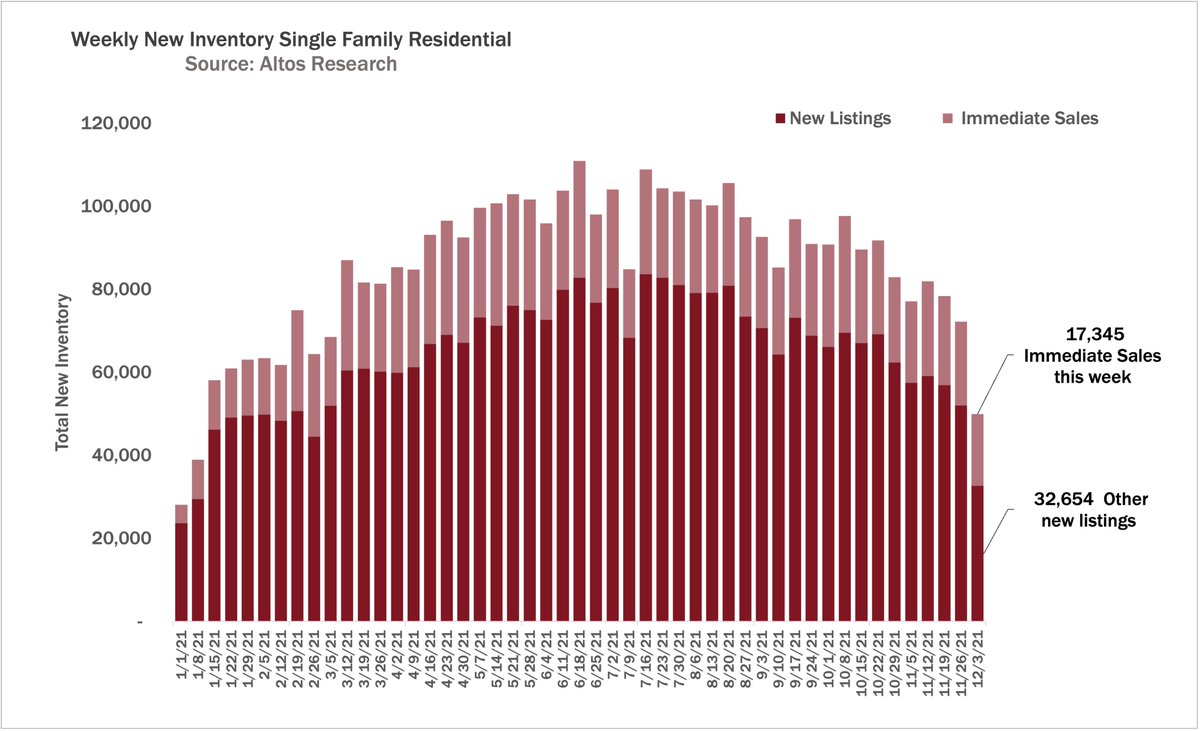
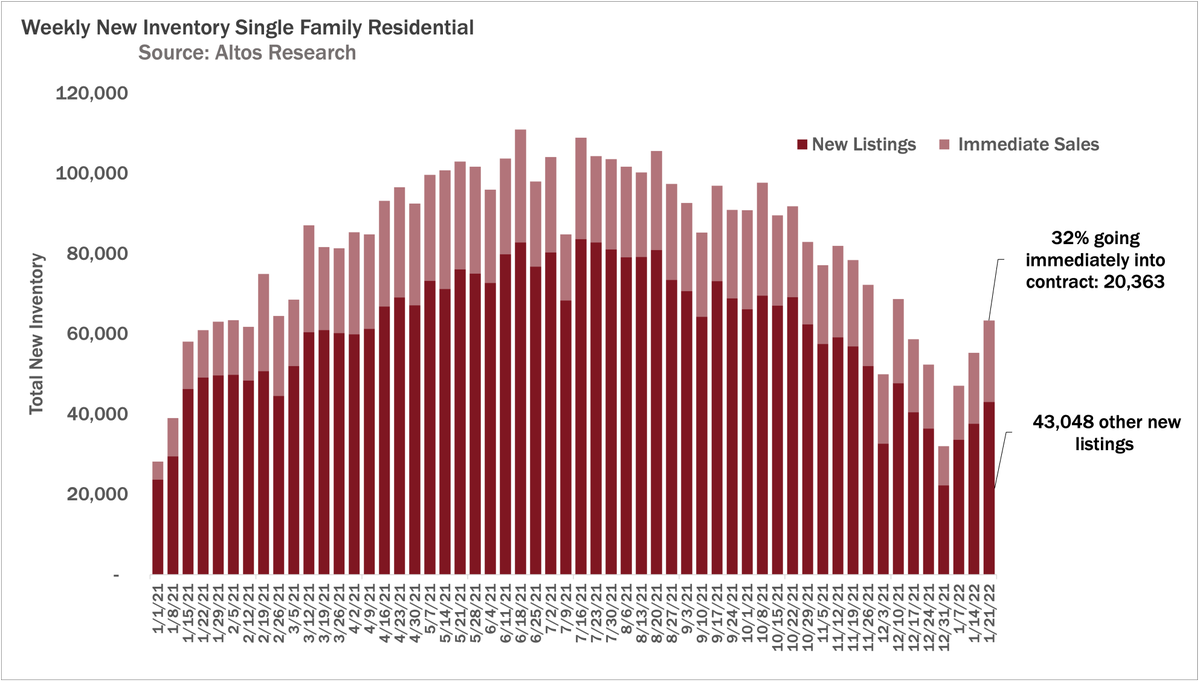
The percentage of new listings that are going into contract essentially immediate is climbing(!) up to 32% this week. Nuts.

2/7
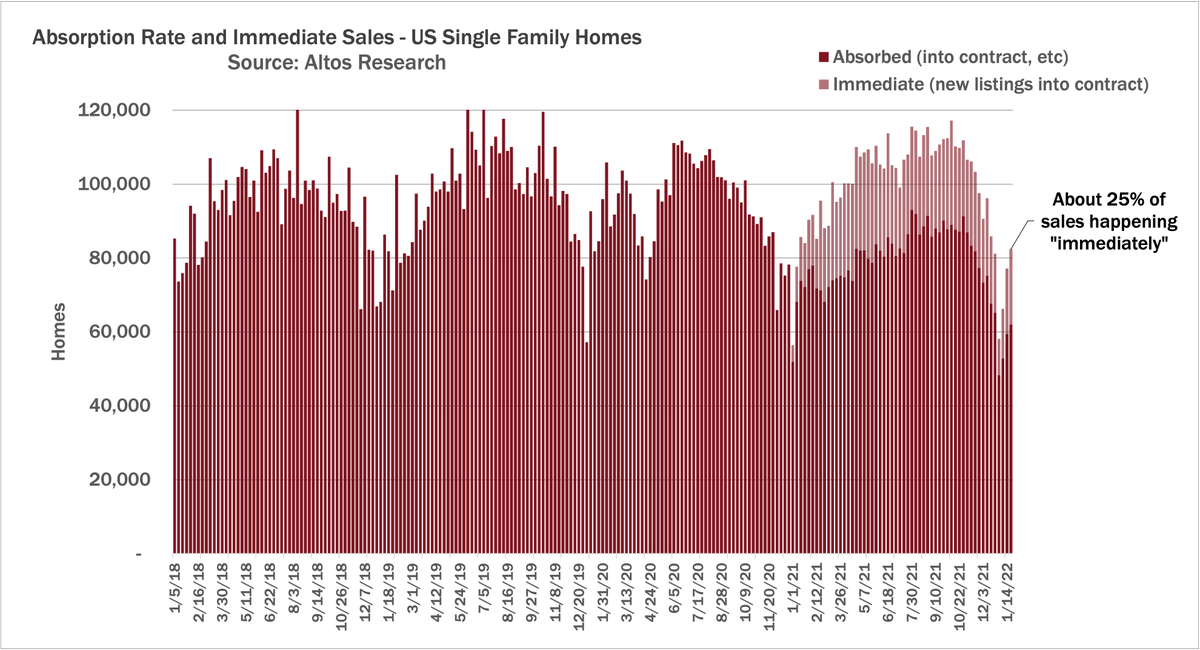
Since those immediate sales are both new inventory AND new sales in the same week, here's the other view. Immediate sales are 25% of all those going into contract this week. (We started tracking immediate sales last year.)

3/7
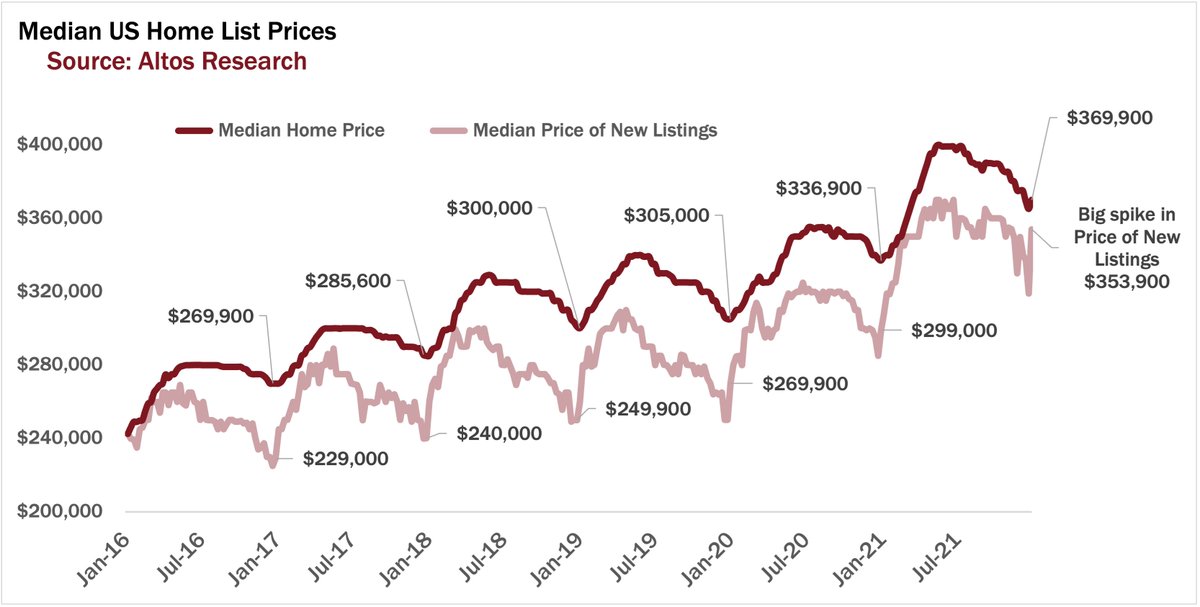
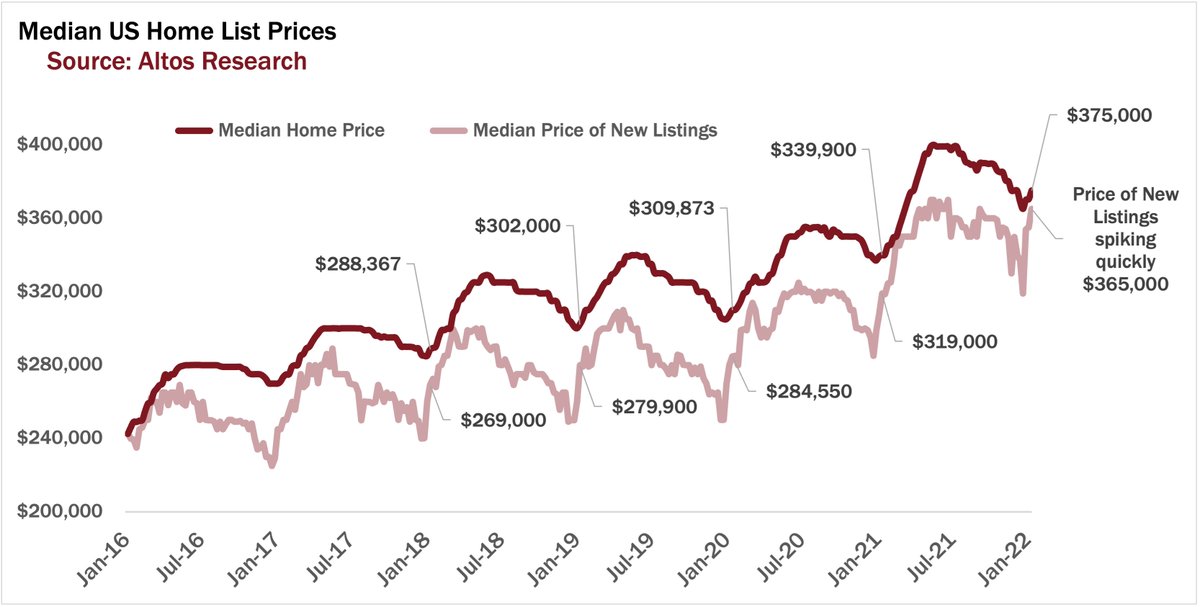
As a result, home prices spiking very quickly already. Median home price is $375,000 in the US this week. The price of the newly listed cohort is spiking even faster, up 2.8% this week. These are sellers communicating what they know about local demand.

4/7
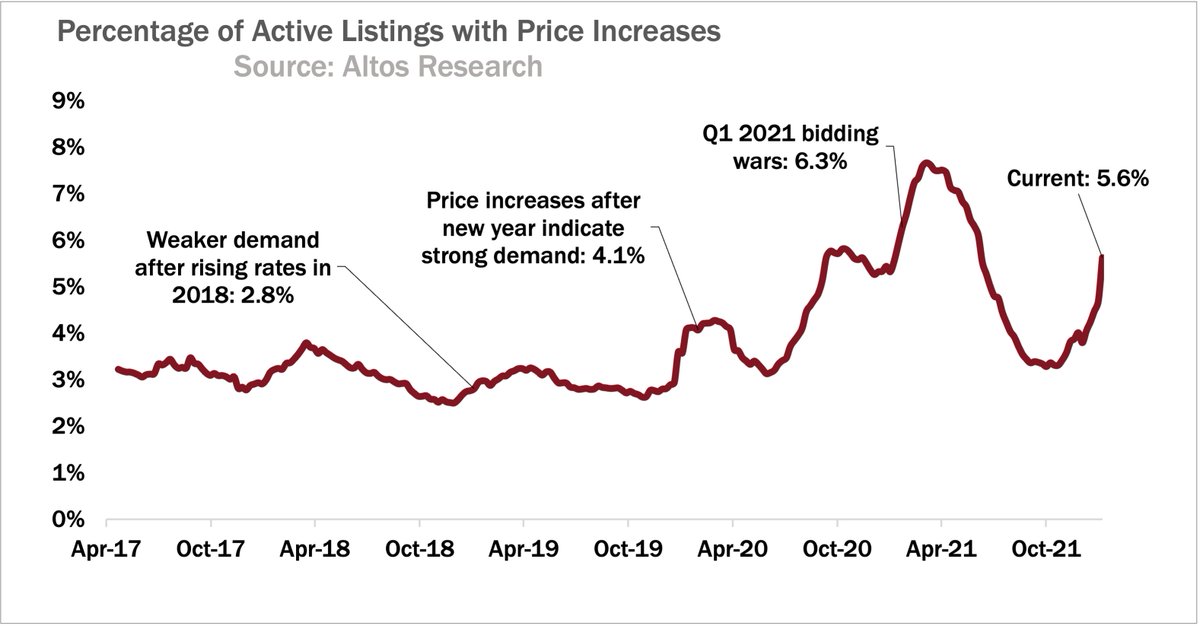
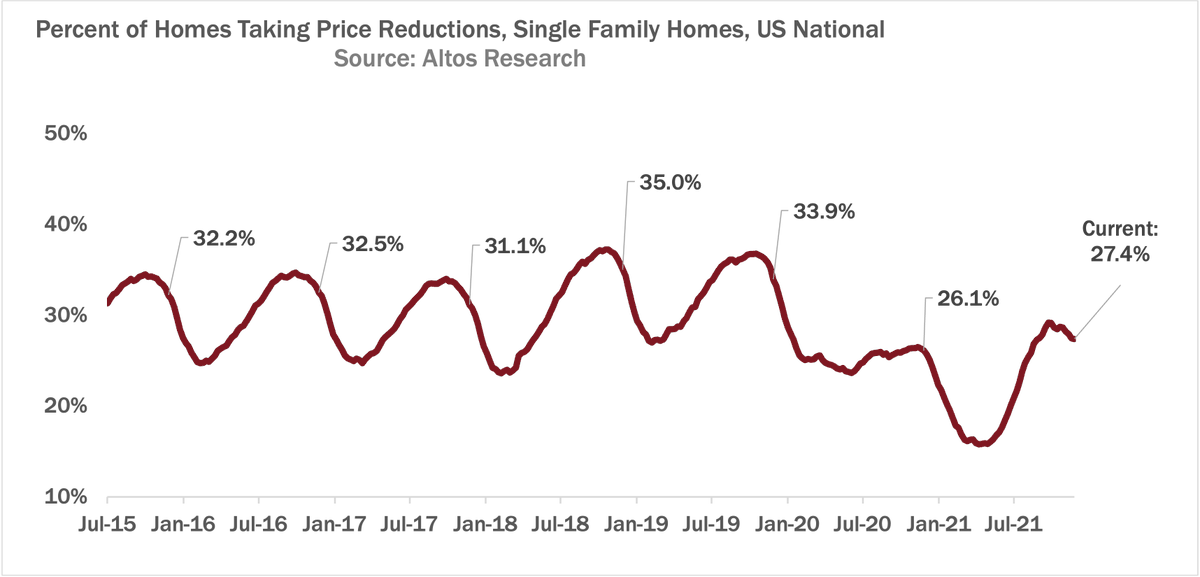
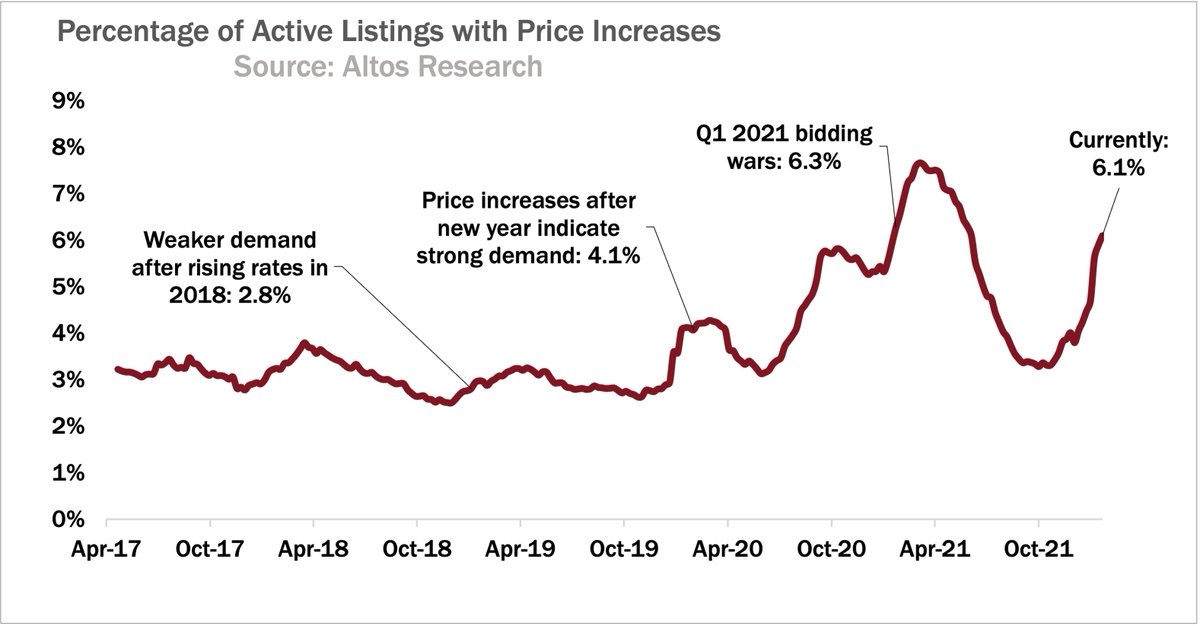
We continue to see the demand in the form of price increases. 6.1% of current listings we saw on the market last fall priced lower. Investors & speculators are leaning into the hot demand. Hopefully macro changes take the some of the steam out of this trend.

5/7
Keep in mind: home buying is much more driven by life events than by financial events. Marriage, kids, divorce, retirement.

Also - buyers right now locked rates and sold financial assets to raise cash a while ago - at the peak. That bodes well for near-term housing.

6/7
Stock & crypto volatility very much on my mind. Here's how to look for impact in residential real estate.

7/7

Full transcript available on the Altos Research blog:

blog.altosresearch.com/home-prices-coโ€ฆ

โ€ข โ€ข โ€ข

Missing some Tweet in this thread? You can try to force a refresh
ใ€€

Keep Current with Mike Simonsen ๐Ÿ‰

Mike Simonsen ๐Ÿ‰ Profile picture

Stay in touch and get notified when new unrolls are available from this author!

Read all threads

This Thread may be Removed Anytime!

PDF

Twitter may remove this content at anytime! Save it as PDF for later use!

Try unrolling a thread yourself!

how to unroll video
  1. Follow @ThreadReaderApp to mention us!

  2. From a Twitter thread mention us with a keyword "unroll"
@threadreaderapp unroll

Practice here first or read more on our help page!

More from @mikesimonsen

Jan 10
Prepare for bidding wars and intense RE buyer competition this spring. The early data is in and it's crazier than I expected.

Inventory is at a new record low, 292,000 single family homes on the market. But that's not the real story this week.

@AltosResearch ๐Ÿ“ฝ๏ธ๐Ÿงต๐Ÿ‘‡

1/6
The big news is how fast the Price of the New Listings jumped this week (light red line here). PNL captures what sellers already know about demand in their market.

This year's jump is higher, faster than we expected.

These are prices for *future* transactions.

2/6
Another leading indicator: Price increases for homes that we saw on the market last fall. Compare to January of 2019 after a year of rising rates in 2018, price increases were muted with demand.

Price increases are spiking again like last year. ๐Ÿ”ฅ๐Ÿ˜ฎ
Prepare for bidding wars
3/6
Read 7 tweets
Dec 6, 2021
Big drop in available inventory post Thanksgiving holiday. Down to just 350,000 existing single family homes on the market.

Man, 2022 sure is shaping up to be competitive again for buyers. No relief anywhere in sight.

This week's @AltosResearch video has the details๐Ÿงต๐Ÿ“ฝ๏ธ๐Ÿ‘‡

1/7
Buyers still gobbling up available homes as quickly as they can. 17,000 immediate sales last week.

The far right end bar in this chart shows our holiday. This week will bounce back a bit, but volumes mostly lower though New Years.

2/7
Price reductions are lower than normal because demand is not abating. Still only 27% of homes have had price reductions.

Tight supply / high demand dynamic appears to be with us until something major in the economy changes.

3/7
Read 8 tweets
Nov 8, 2021
Help me flesh out (and name) a phenomenon I'm observing?

Postulate: In the social media universe, ALL political/social positions must evolve to where both sides can look at the same underlying data and claim justification.
example 1: covid data. Infection and death rates are evidence that...

A) We have had too many protections and restrictions
or
B) Protections and restrictions have been justified
example 2: inflation. The current inflation rate is evidence that...

A) we're overspending, panic
or
B) we're solving problems, celebrate
Read 5 tweets
Nov 8, 2021
Surprise! Inventory of homes for sale is actually falling faster than expected for this time of year.

Down to just over 400,000 single family homes on the market. Inventory fell by 3% this week.

This week's thread and video with the #altosresearch real estate data
๐Ÿงต๐Ÿ‘‡
1/6
Demand is staying elevated even as supply shrinks for the holidays. One place to see that is in our Immediate Sales tracker. Still 25% of the new listings of homes for sale are going into contract essentially immediately each week, even as total volume ticks down.

2/6
Another place to see demand strong relative to supply is in the Altos Research Market Action Index. See how the readings have actually been ticking up this fall, when normally they'd be flat to down.

3/6
Read 6 tweets
Sep 6, 2021
Home buyers tapping into late summer opportunities!

Even as inventory ticks up this week, prices are holding strong. Median home price in the US this week is $389,000, unchanged from a week ago.

Weekly @AltosResearch US real estate market data thread and video ๐Ÿงต๐Ÿ‘‡

1/6
We're looking at 10% annual price gains as we wrap summer. You can see the market has cooled down from the insanity of April.

In a few months the lagging measures of home prices, like the Case Shiller will catch up with the Altos data here.

2/6
Inventory rose this week. Up 1.4% to 437,000 unsold single family homes. Even though the 2021 cycle has shifted later by a month, it's likely we're roughly at peak inventory.

Still 25% fewer homes available than last year, but up 42% from the bottom.

3/6
Read 6 tweets
Aug 23, 2021
Available inventory of unsold single family homes jumped another 2.2% this week. What the heck is going on? Time to panic? Time to celebrate?

Check out this week's #altosresearch thread and video for the details. Video link below

๐Ÿงต๐Ÿ‘‡

1/6
Just a few weeks ago I expected inventory to top out at 400,000. We're well past that now and not slowing down. Lots of new sellers hitting the market.

Will we peak at 460,000 in September? 500k in October? Will we end the year with more inventory than we started?

2/6
On the demand side, we can see that buyers are still aggressive even as inventory builds. Our immediate sales tracker hasn't backed off at all.

23% of the 105,000 new listings went into contract within hours or just days of hitting the market.
3/6
Read 6 tweets

Did Thread Reader help you today?

Support us! We are indie developers!


This site is made by just two indie developers on a laptop doing marketing, support and development! Read more about the story.

Become a Premium Member ($3/month or $30/year) and get exclusive features!

Become Premium

Too expensive? Make a small donation by buying us coffee ($5) or help with server cost ($10)

Donate via Paypal

Or Donate anonymously using crypto!

Ethereum

0xfe58350B80634f60Fa6Dc149a72b4DFbc17D341E copy

Bitcoin

3ATGMxNzCUFzxpMCHL5sWSt4DVtS8UqXpi copy

Thank you for your support!

Follow Us on Twitter!

:(