A Thread on Ratio analysis and respective charts
No need to grab a coffee,Chai will do😄
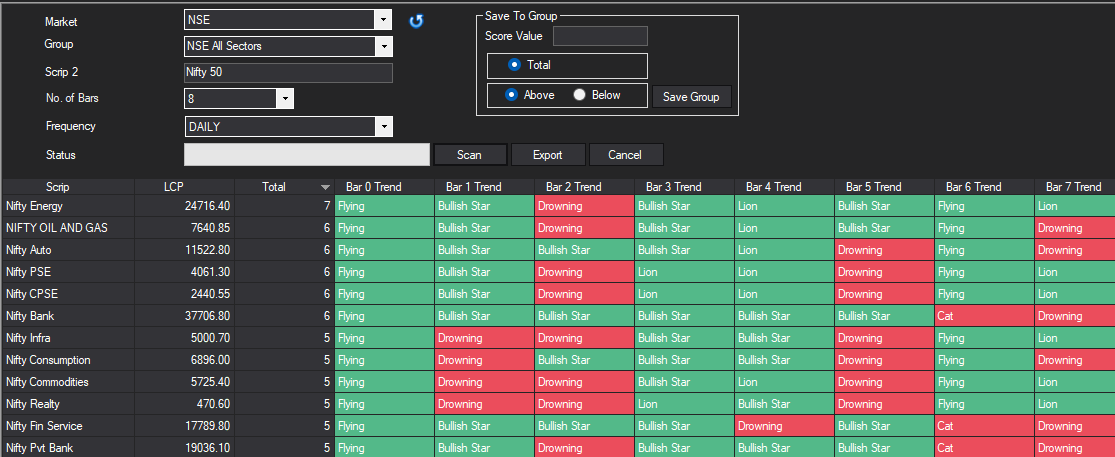
The idea is to identify relatively stronger sectors & stocks when breadth is weak
Breadth=DT 1% (No of stocks in Double top buy on 1% PnF chart)
Breadth started falling from 14th Jan 2022
No need to grab a coffee,Chai will do😄
The idea is to identify relatively stronger sectors & stocks when breadth is weak
Breadth=DT 1% (No of stocks in Double top buy on 1% PnF chart)
Breadth started falling from 14th Jan 2022

So we need to identify sectors which remained resilient when market breadth was falling.
We will look back 8 trading sessions and any score above or equal to 5 is bullish (63% of times Sector outperformed benchmark)
We will look back 8 trading sessions and any score above or equal to 5 is bullish (63% of times Sector outperformed benchmark)

Mean reversals are best suited for current market breadth scenario. Once we have identified the sector the next step is to identify stocks in same fashion.
However the idea is to pick only stocks which are taking support near 50 or 200 EMA
Let us begin with first sector 👇
However the idea is to pick only stocks which are taking support near 50 or 200 EMA
Let us begin with first sector 👇
Sector 1 - Nifty Energy - Score 7
#IOC - 50 EMA
#TATAPOWER - 50 EMA
#GAIL - 50 and 200 EMA
#NTPC - 50 EMA (Holding)


#IOC - 50 EMA
#TATAPOWER - 50 EMA
#GAIL - 50 and 200 EMA
#NTPC - 50 EMA (Holding)


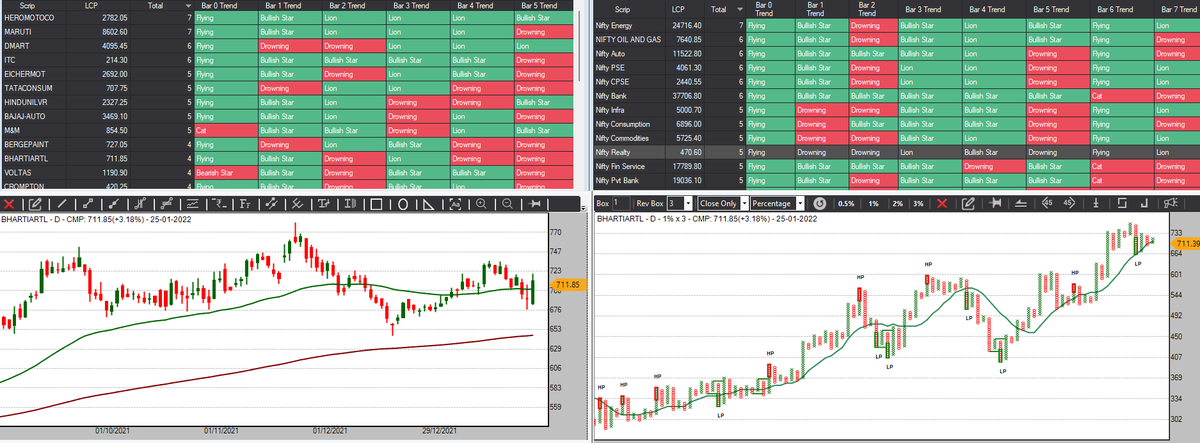
Sector 3 - Auto - Score 6
#HeroMoto - 200 EMA
#EicherMoto - 50 and 200 EMA
#ExideInd - 50 and 200 EMA
#MnM - 50 EMA


#HeroMoto - 200 EMA
#EicherMoto - 50 and 200 EMA
#ExideInd - 50 and 200 EMA
#MnM - 50 EMA


Sector 4 and 5 - PSE and CPSE - score 6
Most of the charts covered in Energy and Oil-Gas
Most of the charts covered in Energy and Oil-Gas
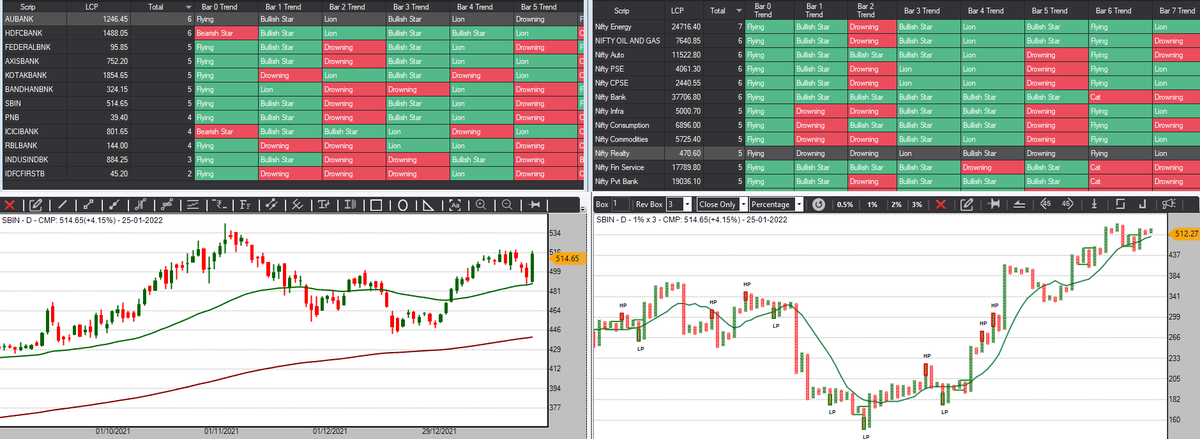
Sector 6- Banks - Score 6
#SBIN - 50 EMA (Holding)
#FederalBank - 50 EMA
#AxisBank - 50 and 200 EMA
#KotakBank - 200 EMA
#ICICIBank - 50 EMA (Wait for FT)
#PNB - 50 and 200 EMA (Holding)


#SBIN - 50 EMA (Holding)
#FederalBank - 50 EMA
#AxisBank - 50 and 200 EMA
#KotakBank - 200 EMA
#ICICIBank - 50 EMA (Wait for FT)
#PNB - 50 and 200 EMA (Holding)


Sector 9 - Commodities - score 5
Stocks covered in previous sectors
Sector 10 - Realty - score 5
Stocks covered in previous sectors (DLF), Lodha is at 50 EMA support
Stocks covered in previous sectors
Sector 10 - Realty - score 5
Stocks covered in previous sectors (DLF), Lodha is at 50 EMA support
Sector 12 - Private bank
Stocks covered in previous sector.
Dont jump right in to these stocks. Wait for column reversals on 1% and on EOD basis.
I personally prefer weekly ATR for positional sizing so risk per scrip is fixed.
Almost 30 stocks and 12 sectors covered!
Stocks covered in previous sector.
Dont jump right in to these stocks. Wait for column reversals on 1% and on EOD basis.
I personally prefer weekly ATR for positional sizing so risk per scrip is fixed.
Almost 30 stocks and 12 sectors covered!
Missed couple of charts from Realty.
Sunteck, Brigade, Oberoi and Prestige are all at 50 EMA support
Sunteck, Brigade, Oberoi and Prestige are all at 50 EMA support
• • •
Missing some Tweet in this thread? You can try to
force a refresh


