How to use Top Down Approach for Stock Selection ?
Weak Vs Strong Sectoral Analysis
Weak Vs Strong Stock Analysis
A thread 📩
Weak Vs Strong Sectoral Analysis
Weak Vs Strong Stock Analysis
A thread 📩
Step 1 : Choose the Strongest Sector
Use The concept of Relative Strength to identify Strong Sector .
Example Comparing Auto Vs Nifty
Here we can See the 65 RS line is Positive and Increasing meaning A outperformance of AUTO index
2/n
Use The concept of Relative Strength to identify Strong Sector .
Example Comparing Auto Vs Nifty
Here we can See the 65 RS line is Positive and Increasing meaning A outperformance of AUTO index
2/n

How to Apply RS and How to Use It ⏬
3/n
https://twitter.com/JayneshKasliwal/status/1480449068891455488?s=20
3/n
Look For Strongest Sectors
Like : PSUBANKS , AUTO and INFRA
The RS line Should be Preferred Sloping up
Use 65 RS for Short Term and 130 for Midterm Holding
4/n

Like : PSUBANKS , AUTO and INFRA
The RS line Should be Preferred Sloping up
Use 65 RS for Short Term and 130 for Midterm Holding
4/n


What do Weak Sectors Look Like ?
Nifty : Pharma Fmcg It
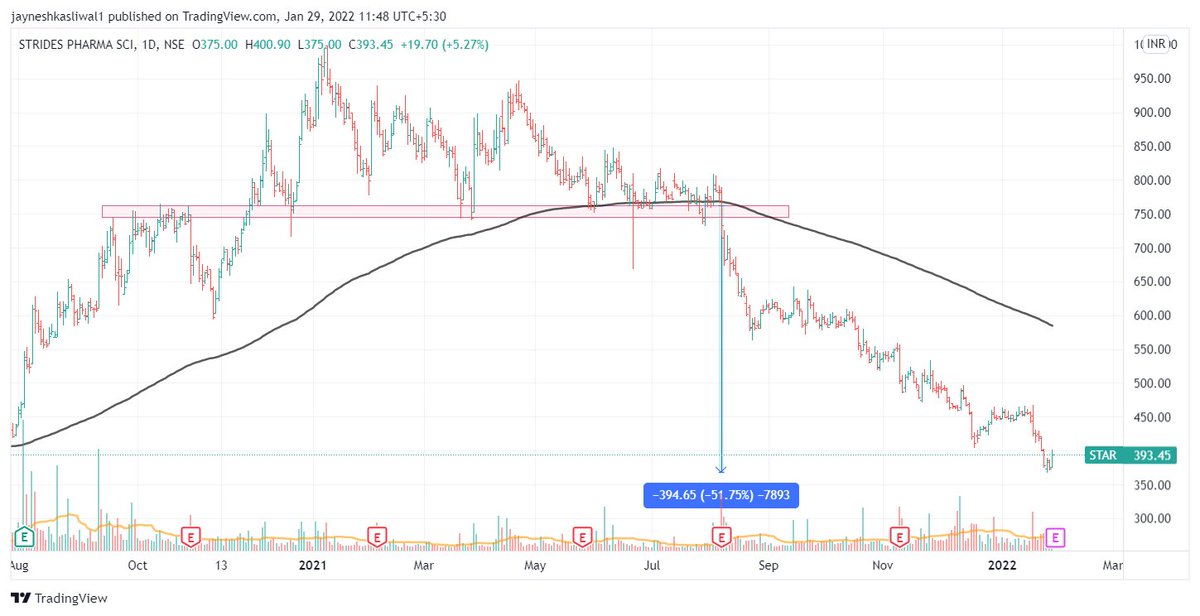
This Sector Should be completely AVOIDED for trading as the whole sector is underperforming
5/n


Nifty : Pharma Fmcg It
This Sector Should be completely AVOIDED for trading as the whole sector is underperforming
5/n


Now As we have Selected The Strongest Sectors
Lets select the Strongest Stock in that particular Sector Using Stock Vs Sector Analysis
Outperformers : Canara Bank , SBIN
RS settings
6/n


Lets select the Strongest Stock in that particular Sector Using Stock Vs Sector Analysis
Outperformers : Canara Bank , SBIN
RS settings
6/n


Similary in AUTO sector Some Stoccks will be weak and some will be strong .
Bet on the winning hose and not on loosing horse by identifying outperformers .
Example :
Hero Vs Maruti
Which Stock to Select ?
8/n

Bet on the winning hose and not on loosing horse by identifying outperformers .
Example :
Hero Vs Maruti
Which Stock to Select ?
8/n


If you Want to Learn Swing Trading
Use the Link Below to Get Recording And attend Live Sessions
app.cosmofeed.com/view_group/61f…
9/n
Use the Link Below to Get Recording And attend Live Sessions
app.cosmofeed.com/view_group/61f…
9/n
• • •
Missing some Tweet in this thread? You can try to
force a refresh


