DTBhat Profile picture
Jan 30, 2022 6 tweets 3 min read Read on X
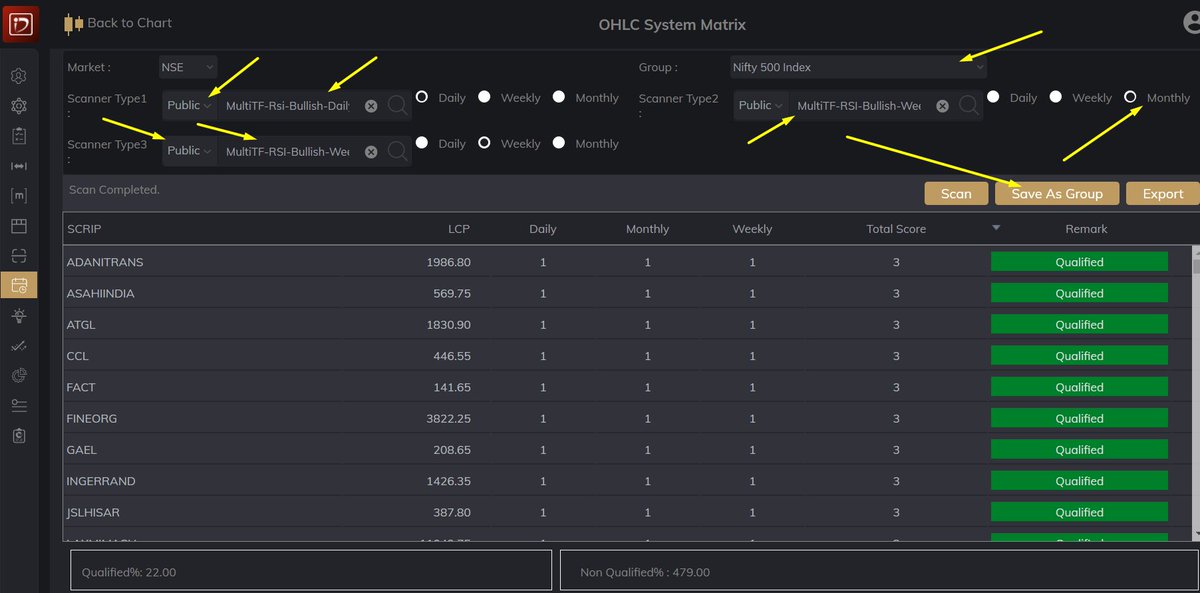
A small multi time frame system to identify stronger stocks based on RSI/SuperTrend/EMA
@Definedge
Conditions:
a) RSI > 55 < 70 in daily
b) RSI > 60 in weekly/monthly
c) Candle close above SuperTrend(10,3)
d) Candle close above 200EMA in daily and 34EMA in weekly/monthly
+
I have published these scanners in TradePoint Web of @Definedge. These scanners can also be developed in TradePoint Desktop.
1) Run these scanners on Multi Time Frame Scanners
+
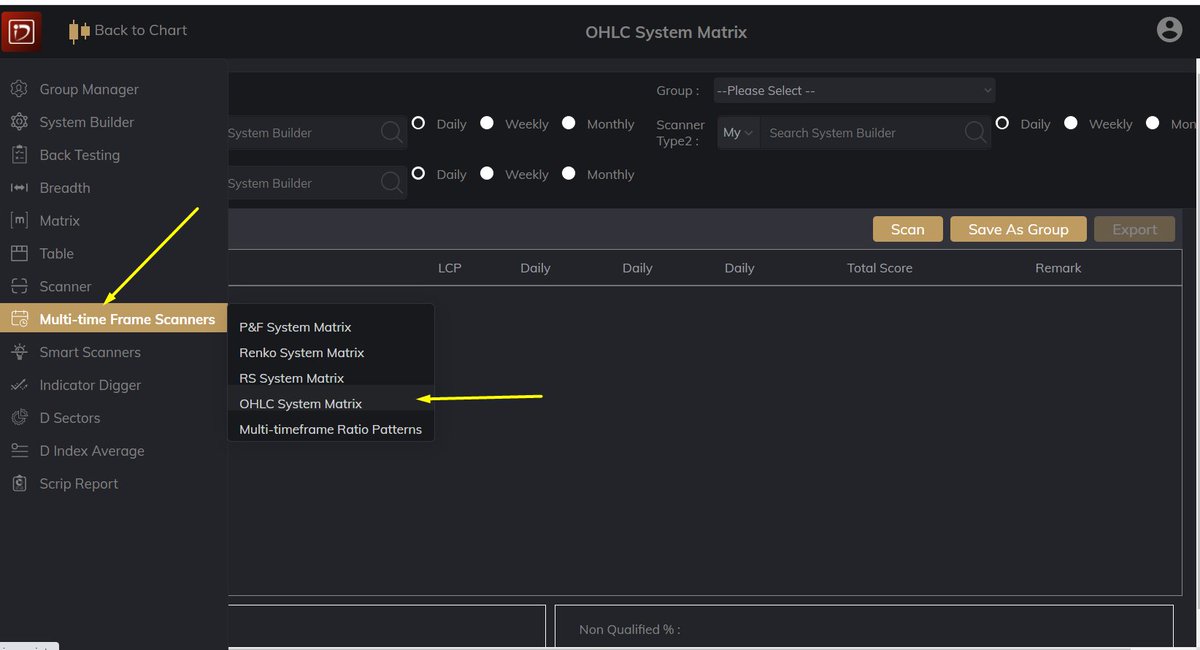
Save the qualified candidates (score above 2) to a group for doing further analysis.
+3
Run FusionMatrix on this group to check stronger candidates, Sort on RS-Ranking score and select top candidates. Look for long entries based on your favorite systems.
+4
One example #TATAELXSI on daily charts
RS chart bullish ABC pattern and in Price chart probable bear trap and bullish ABC
(bullish divergence between price and RS charts also)
+5
Another way of doing further study is to run Heikin-Ashi bullish reversal scanner on the short-listed candidates. This scanner is also published in TradePoint.
I ran this scanner and the result as follows:
Example of #ONGC

• • •

Missing some Tweet in this thread? You can try to force a refresh
 

Keep Current with DTBhat

DTBhat Profile picture

Stay in touch and get notified when new unrolls are available from this author!

Read all threads

This Thread may be Removed Anytime!

PDF

Twitter may remove this content at anytime! Save it as PDF for later use!

Try unrolling a thread yourself!

how to unroll video
  1. Follow @ThreadReaderApp to mention us!

  2. From a Twitter thread mention us with a keyword "unroll"
@threadreaderapp unroll

Practice here first or read more on our help page!

More from @dtbhat

Sep 14, 2023
Options strategies - In this thread I will explain how a profitable CE buy position can be adjusted to reduce risk. Guess my choice. I will reveal it tomorrow.
1) I had taken a 20100CE long today at 111.2 about an hour before close. Image
2) Shift 20100CE to 20200CE (50 delta to 40 delta). The payoff will be like this.
Max risk reduced to half Image
3) Convert to a bull call spread.
* Shift 20100CE to 20200CE
* Short 20300CE - same qty Image
Read 4 tweets
May 7, 2023
I am sharing an options trade and its adjustments which I did recently. I had goofed up in one of the straddle shorts in Nifty. At one stage I was down nearly 1.5% of total capital but with some hectic adjustments and (some luck) I could escape with almost no loss at the end.
1/n
1) Initiated a #Nifty straddle at 17850 strike on 26052023 for 04052023 expiry at fag end of the day at 15:29 . I had forgotten about this trade as I was on holidays from 27052023.
2/n Image
2) I did not check the status of straddle on 27052023. Status at the beginning and end of the day
3/n ImageImage
Read 19 tweets
Mar 5, 2023
#BankNiftyOptions #IronFly
On popular demand I am sharing the adjustments I made to get out with good profits.
1) BNF started trending - brought the CE buy leg inside to 41000CE (at 9:27)did not exit 41100CE (delayed shifting)
2) Naked selling 40600PE (at 9:42 ) using #DOS
+2/n
+2/n
3) exited 41100CE (10:03) and added 40600PE (at 10:22)
4) Now thought of adding a broken wing fly at 41000 (at around 10:22). Brought the buy wing to 40900CE
5) Abandoned the idea and closed 40900CE and 40500CE (part of original IFLY at 10:25)

+3/n
3/n
6) Created a debit spread at 41000CE - 41500CE
shorted 41500CE (at 10:27)
7) BN was nicely trending- did delta drifting to 41100CE, 41200CE
8) At this stage thought BN might do mean reversal and prepared for creating BFLY at 41300-41500-41700. So bought 41700CE (11:36)
+4/n
Read 5 tweets
Feb 16, 2023
A thread to demonstrate how a profitable options trade can be converted to a crown strategy. Learnt this recently from @NiftyOptionss
I had initiated a naked put sell on 31-Jan-2023
1) Sold 4 lots 17000PE
2) Shifted to 4 lots 17500PE
3) Today shifted to 18000PE
+ 1/n ImageImage
4) Convert to put butterfly at 18000 strike
-5 lots 18000PE
+5 lots 18200PE
+5 lots 17800PE

2/n ImageImage
5) Add a put butterfly
+ 5 lots 17800PE
- 10 lots 17700PE
+ 5 lots 17600PE

3/n ImageImage
Read 4 tweets
Sep 25, 2022
IronFly simulation - Initiated IRONFLY on 01.Sep.2022(Thursday for next week expiry)
ATM Straddle has premium above 350, initiate wings slightly inside this range
+2/n
+ 17250PE
- 17550PE
- 17550CE
+ 17850CE
2/n
02-Sep-22 (Friday) 9:20 Nifty inside the wings
02-Sep-22 (Friday) 15:20 Nifty inside the wings
No adjustment
+3/n
3/n
05-Sep-22 (Monday) 9:20 Nifty inside the wings
05-Sep22 (Monday) 15:20 Nifty inside the wings
No adjustment
+4/n
Read 7 tweets
Apr 24, 2022
Let us discuss a simple pullback scanner which I use for swing/positional trades.
1) I am looking for stocks which have become oversold recently (as per PMOX indicator) and positive column reversal has taken place.
2) To achieve this I look for PMOX - oversold either in column 1
or column 3.
3) Check whether column reversal has taken place in the current column (at column 0)
4) Next I am adding a few filters -
* Price above MA
* No of boxes in the latest column is less than 10 (this is to limit my SL)
* The stock is not in PMOX bullish momentum. The logic behind this condition is to avoid stocks which are already in bullish momentum.
This scanner is published in TradePoint-Web. Look for
"PMOX-BuyWhenOversold" under Point And Figure Image
Read 5 tweets

Did Thread Reader help you today?

Support us! We are indie developers!


This site is made by just two indie developers on a laptop doing marketing, support and development! Read more about the story.

Become a Premium Member ($3/month or $30/year) and get exclusive features!

Become Premium

Don't want to be a Premium member but still want to support us?

Make a small donation by buying us coffee ($5) or help with server cost ($10)

Donate via Paypal

Or Donate anonymously using crypto!

Ethereum

0xfe58350B80634f60Fa6Dc149a72b4DFbc17D341E copy

Bitcoin

3ATGMxNzCUFzxpMCHL5sWSt4DVtS8UqXpi copy

Thank you for your support!

Follow Us!

:(