DTBhat Profile picture
Jan 30 6 tweets 3 min read
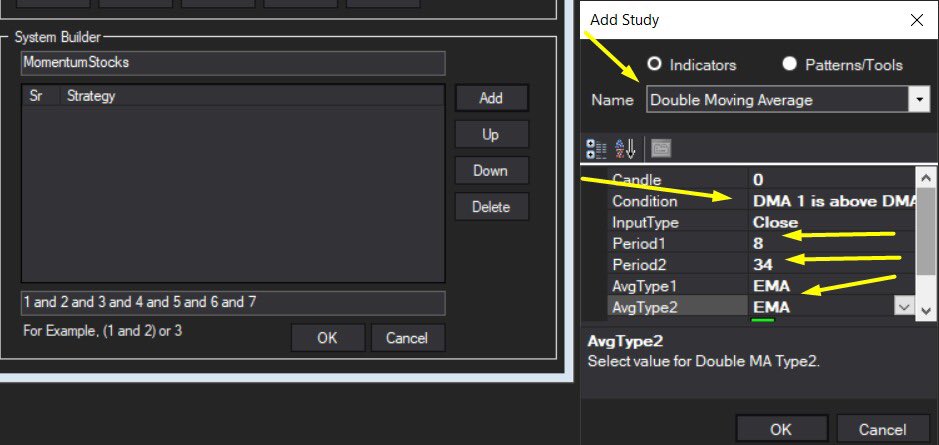
A small multi time frame system to identify stronger stocks based on RSI/SuperTrend/EMA
@Definedge
Conditions:
a) RSI > 55 < 70 in daily
b) RSI > 60 in weekly/monthly
c) Candle close above SuperTrend(10,3)
d) Candle close above 200EMA in daily and 34EMA in weekly/monthly
+
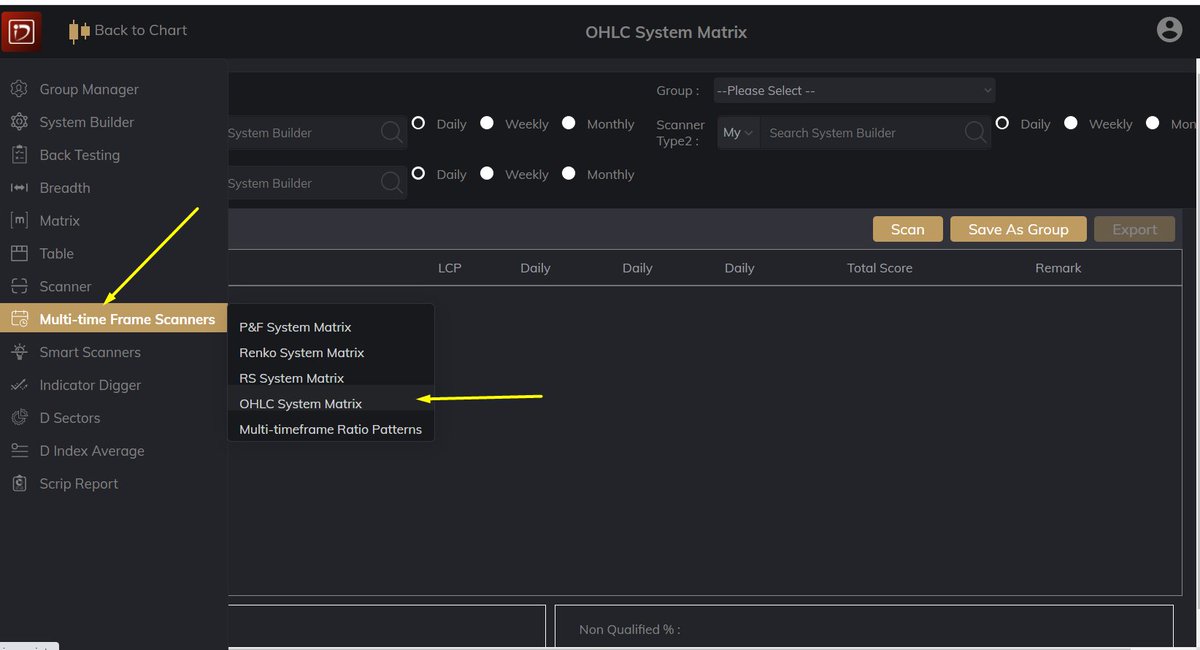
I have published these scanners in TradePoint Web of @Definedge. These scanners can also be developed in TradePoint Desktop.
1) Run these scanners on Multi Time Frame Scanners
+
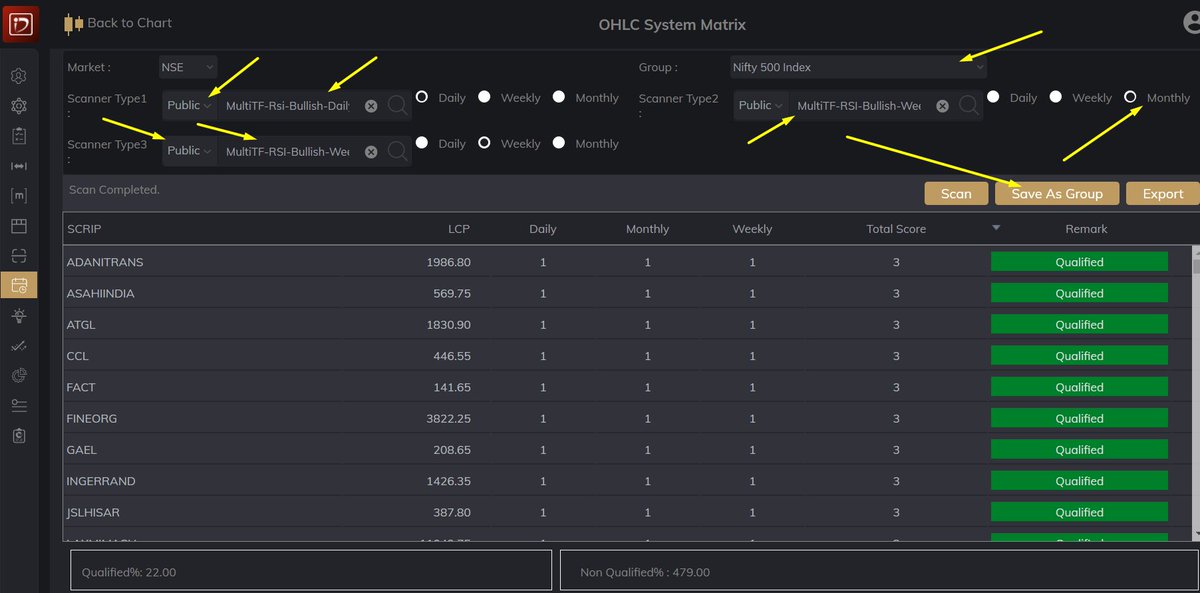
Save the qualified candidates (score above 2) to a group for doing further analysis.
+3
Run FusionMatrix on this group to check stronger candidates, Sort on RS-Ranking score and select top candidates. Look for long entries based on your favorite systems.
+4
One example #TATAELXSI on daily charts
RS chart bullish ABC pattern and in Price chart probable bear trap and bullish ABC
(bullish divergence between price and RS charts also)
+5
Another way of doing further study is to run Heikin-Ashi bullish reversal scanner on the short-listed candidates. This scanner is also published in TradePoint.
I ran this scanner and the result as follows:
Example of #ONGC

• • •

Missing some Tweet in this thread? You can try to force a refresh
 

Keep Current with DTBhat

DTBhat Profile picture

Stay in touch and get notified when new unrolls are available from this author!

Read all threads

This Thread may be Removed Anytime!

PDF

Twitter may remove this content at anytime! Save it as PDF for later use!

Try unrolling a thread yourself!

how to unroll video
  1. Follow @ThreadReaderApp to mention us!

  2. From a Twitter thread mention us with a keyword "unroll"
@threadreaderapp unroll

Practice here first or read more on our help page!

More from @dtbhat

Aug 29, 2021
The thread explains my momentum scanner and how to build it in #TradePoint software.
@Definedge
Conditions :
1)EMA 8 above EMA 34 and rising
2)Candle close above previous 5 candle high
3) RSI above 60
4) Volume above previous 5 candles
5) ADX above 30
1/n
Select Double Moving Average 8 and 34
2/n
Under Patterns select Close Above Prev Bars
3/n
Read 14 tweets
Jul 2, 2021
This thread will briefly explain my stock selection process for trading

1) At EOD, short list stocks which are in bullish formations or bullish patterns on higher box sizes or time frames. On monthly and weekly time frames or 1% 2% and 3% box sizes
2/n
2) from this, short list stocks that are probable breakout candidates. Here I look for follow through to bullish patterns like super pattern , 💯 pole, turtle Breakout , rare occurrence , bear traps etc
3/n
3) From this list check relative strength against nifty 50 and short list stronger candidates.
Check for price and volume breakouts in candlestick charts on daily timeframes for confirming the momentum
4/n
Read 6 tweets

Did Thread Reader help you today?

Support us! We are indie developers!


This site is made by just two indie developers on a laptop doing marketing, support and development! Read more about the story.

Become a Premium Member ($3/month or $30/year) and get exclusive features!

Become Premium

Too expensive? Make a small donation by buying us coffee ($5) or help with server cost ($10)

Donate via Paypal

Or Donate anonymously using crypto!

Ethereum

0xfe58350B80634f60Fa6Dc149a72b4DFbc17D341E copy

Bitcoin

3ATGMxNzCUFzxpMCHL5sWSt4DVtS8UqXpi copy

Thank you for your support!

Follow Us on Twitter!

:(