NEW: our big story as trailed on Friday is a detailed analysis of the critical importance of vaccination in beating Covid
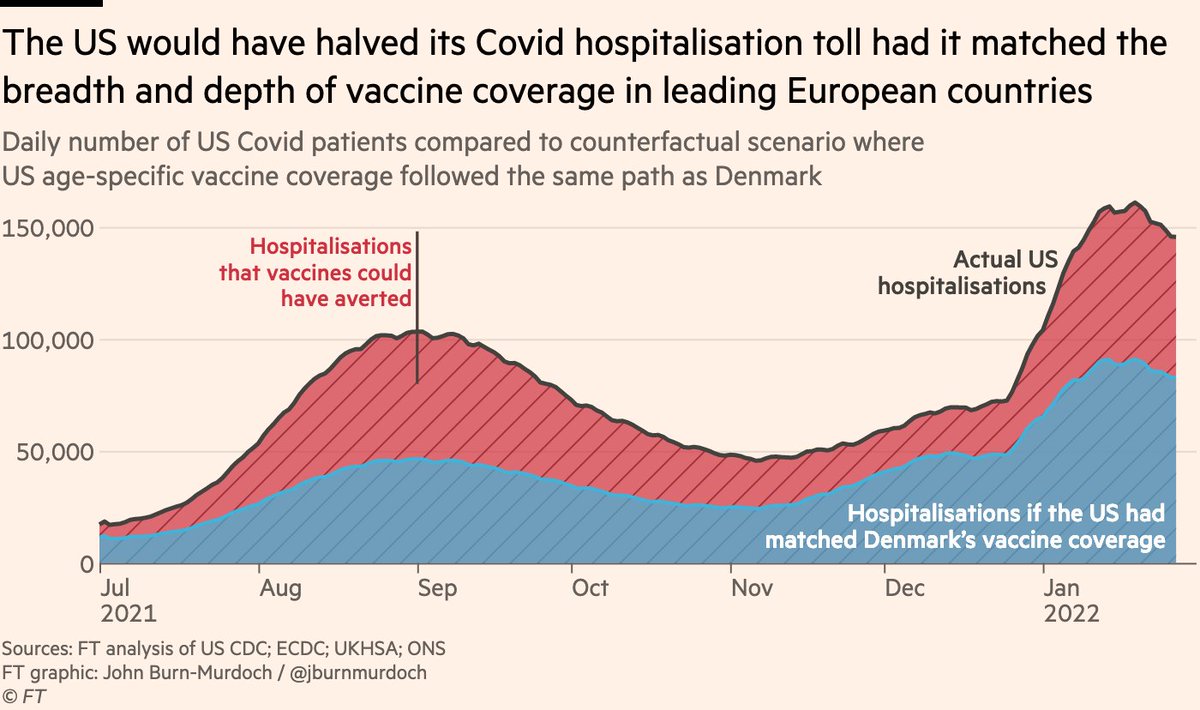
Top-line: if US had matched vaccination coverage of leading European countries, it would have *halved* its Covid hospitalisations
ft.com/content/03aa46…
Top-line: if US had matched vaccination coverage of leading European countries, it would have *halved* its Covid hospitalisations
ft.com/content/03aa46…
This is due to the very steep age-gradient in risk of severe Covid, meaning even small gaps in coverage among the most elderly carry huge risk
https://twitter.com/jburnmurdoch/status/1418952154342166539
Here’s vax uptake and waning among the elderly in the US and several European countries.
Note how that red "unvaxxed elderly" segment extends much further right for the US, with millions still vulnerable well into its summer Delta wave.
Far more severely waned second doses, too
Note how that red "unvaxxed elderly" segment extends much further right for the US, with millions still vulnerable well into its summer Delta wave.
Far more severely waned second doses, too

And this is after the US got off to a big head-start, getting second doses into elderly arms well ahead of Europe.
(👀 second row of charts here)
But where the black line rose first, it stopped rising at a much lower level than leading European countries.
(👀 second row of charts here)
But where the black line rose first, it stopped rising at a much lower level than leading European countries.

So what we’ve done in this story is combine all the data we have on age-specific exposure:
• Baseline pre-vaccine risk of severe disease by age
• Share of age group with x doses, and how much waning
• Vaccine efficacy against Delta and Omicron
• For every day of the last year
• Baseline pre-vaccine risk of severe disease by age
• Share of age group with x doses, and how much waning
• Vaccine efficacy against Delta and Omicron
• For every day of the last year
The result: population-weighted scores for exposure to hospitalisation over time
• Eng & US started rollouts earlier
• But soon overtaken by EU countries (US because rollout slowed, England because AZ)
• Boosters pushed exposure yet lower
• Omi’s immune evasion caused a bump
• Eng & US started rollouts earlier
• But soon overtaken by EU countries (US because rollout slowed, England because AZ)
• Boosters pushed exposure yet lower
• Omi’s immune evasion caused a bump

And that’s where we get these charts showing how one country’s hospitalisation toll might have looked if it had another country’s vax coverage.
We start with the observed data, here for the US, and then multiply it by the ratio between US and Danish exposure scores every day
We start with the observed data, here for the US, and then multiply it by the ratio between US and Danish exposure scores every day

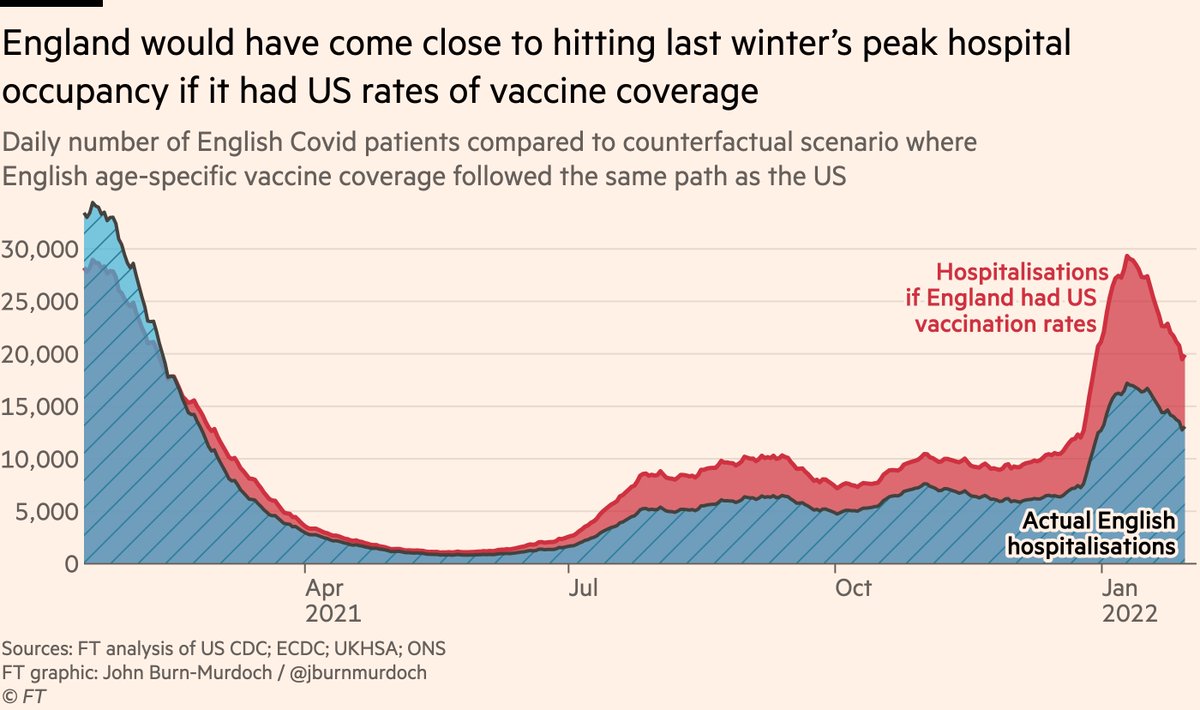
We can also flip the comparison around and see, for example, how English Covid hospitalisations would have looked if we had US vaccination coverage.
The answer: much worse, coming quite close to last winter’s peak.
The answer: much worse, coming quite close to last winter’s peak.
Another interesting counterfactual, as also calculated by @PaulMainwood last week for the Omicron period, is what would things look like without boosters?
In England, hospital occupancy would have (un)comfortably exceeded last winter’s peak.
In England, hospital occupancy would have (un)comfortably exceeded last winter’s peak.

And here’s England with Polish rates of vaccination 😬

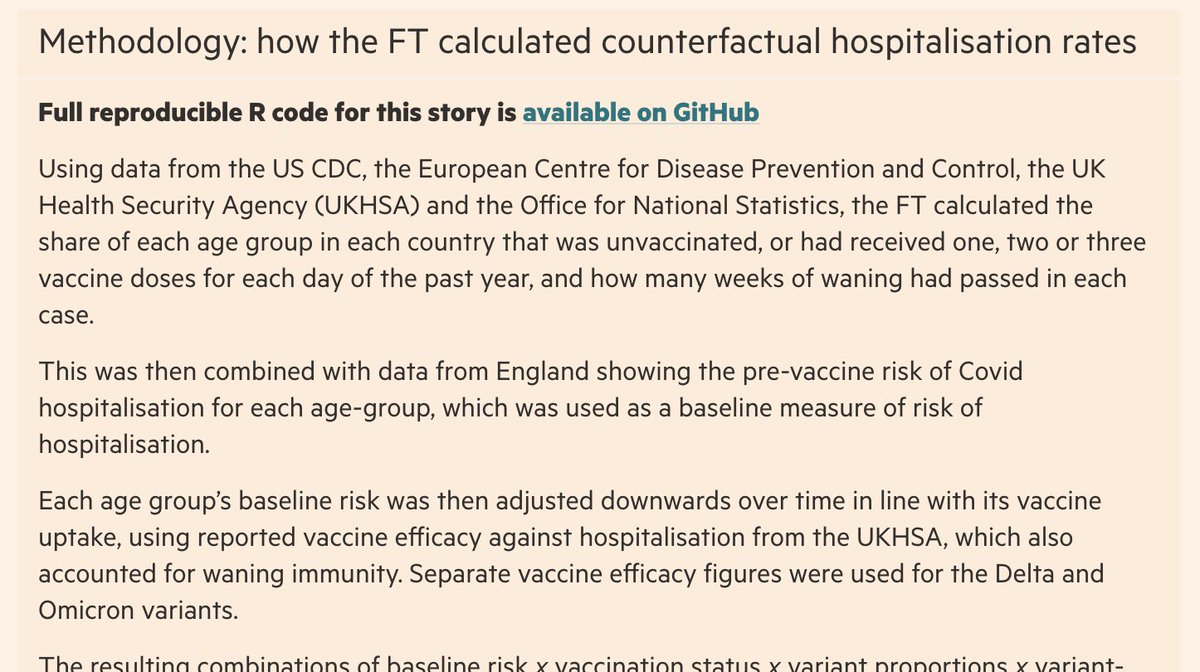
There’s an extensive methodology box on our story, and full reproducible code on GitHub github.com/Financial-Time…
So, why does all of this matter?
Because of this chart.
Covid’s IFR in England has fallen steeply since last winter, but that wasn’t by chance, it was [largely] because of vaccines.
In countries with poor vax coverage, Covid will still be far more than twice as lethal as flu.
Because of this chart.
Covid’s IFR in England has fallen steeply since last winter, but that wasn’t by chance, it was [largely] because of vaccines.
In countries with poor vax coverage, Covid will still be far more than twice as lethal as flu.

For example, here are CFRs for England, Portugal and the US (IFRs are only possible for England, thanks to the @ONS infection survey 🙏)
Just like in hospital exposure chart, poor US vax coverage means its CFR has stayed much higher until Omicron, and remains higher with Omicron
Just like in hospital exposure chart, poor US vax coverage means its CFR has stayed much higher until Omicron, and remains higher with Omicron

And while Omicron’s intrinsic mildness is good news for us all, invaluable data from France (via @nicolasberrod) shows that vaccines still do more to reduce Covid’s lethality than Omicron does.

This matches what we’re hearing more hospital doctors all over the world: even with Omicron, unvaccinated people remain at substantial risk of severe disease and worse
https://twitter.com/kit_delgadoMD/status/1477841257074499586
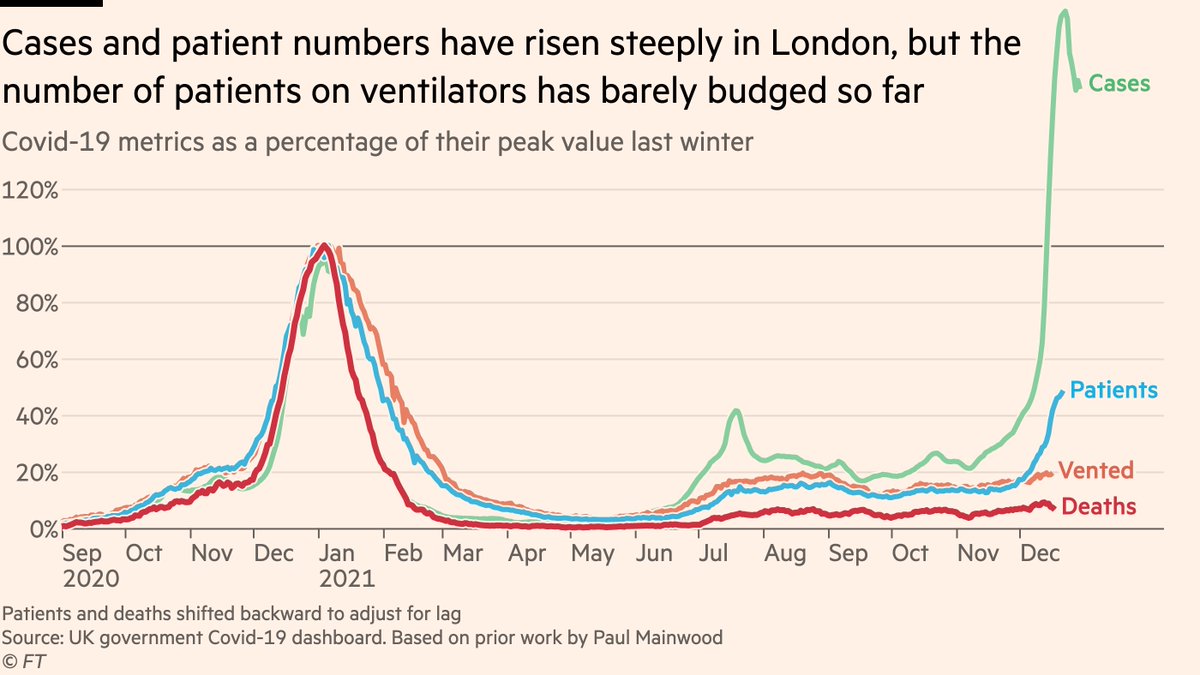
So as long as large numbers of elderly people remain unvaxxed or have waned protection, Covid will continue to be a major burden.
If we want Covid to be over, and to be able to get on with our lives, we need to get everyone vaccinated.
If we want Covid to be over, and to be able to get on with our lives, we need to get everyone vaccinated.
And as many have said, we must also remember Covid is much more transmissible than flu, so even though its lethality per-infection has fallen, the number of infections in any given year is still far, far higher.
Down to 2x lethality 👍
5x infections 😬
Down to 2x lethality 👍
5x infections 😬
https://twitter.com/TWenseleers/status/1487559782118604802
It’s also worth noting that Omicron’s intrinsic mildness was a lucky strike for us. If the next variant is an offshoot of Delta, that gift would be revoked, and everything will rest on vaccines (and infection-acquired immunity) again.
Finally, a very interesting randomised controlled trial into vaccines’ impact on sporting performance concluded over the weekend, with striking results...
Researchers took elite athletes, matched on age and Grand Slam titles, and assigned them to one of two conditions:
Novax ⛔️
Needal 💉
Being unvaxxed was associated with:
• Extended periods of inactivity
• Loss of shared Grand Slam record
• Deportation
Get vaxxed, folks 👍
Novax ⛔️
Needal 💉
Being unvaxxed was associated with:
• Extended periods of inactivity
• Loss of shared Grand Slam record
• Deportation
Get vaxxed, folks 👍
And with that, I’m off on holiday for a week 👋
• • •
Missing some Tweet in this thread? You can try to
force a refresh