Active inventory of homes for sale - how low can we go?
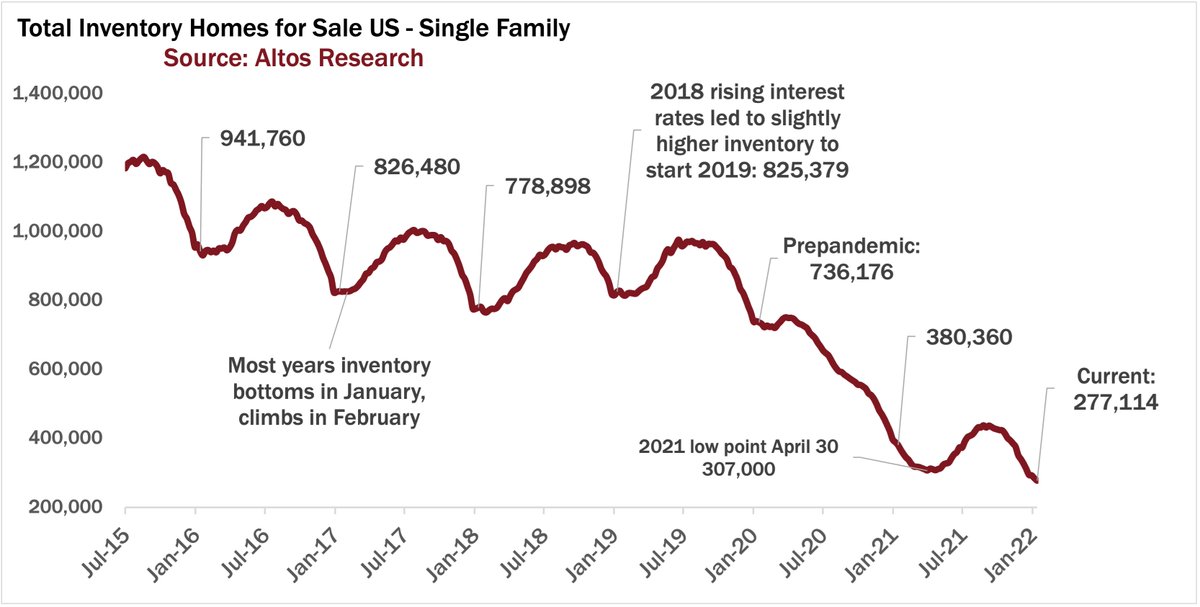
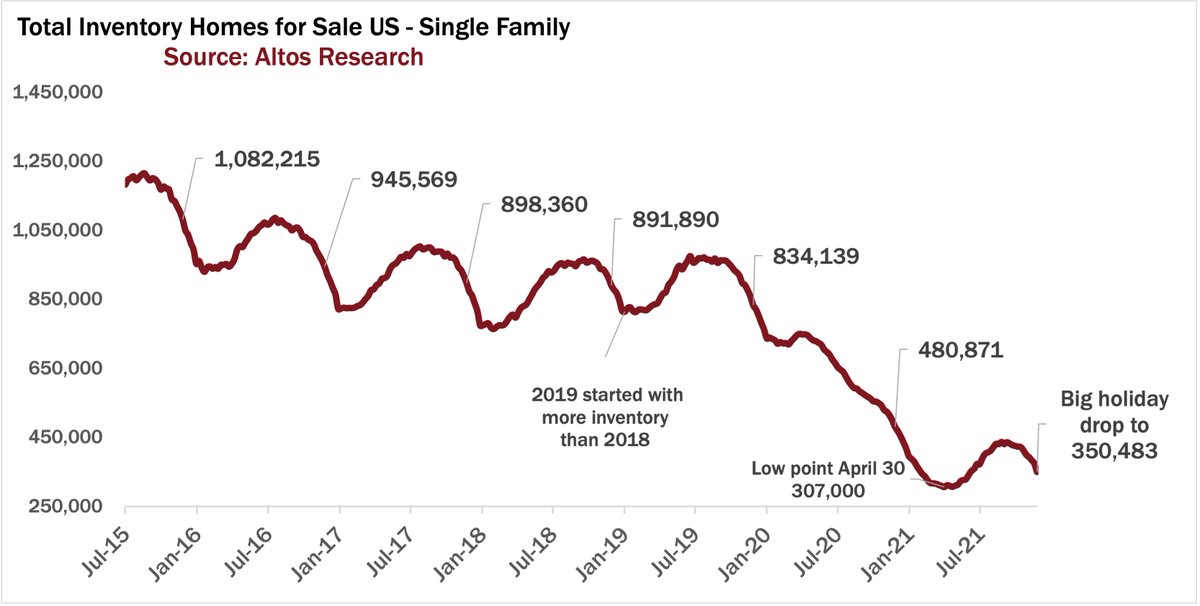
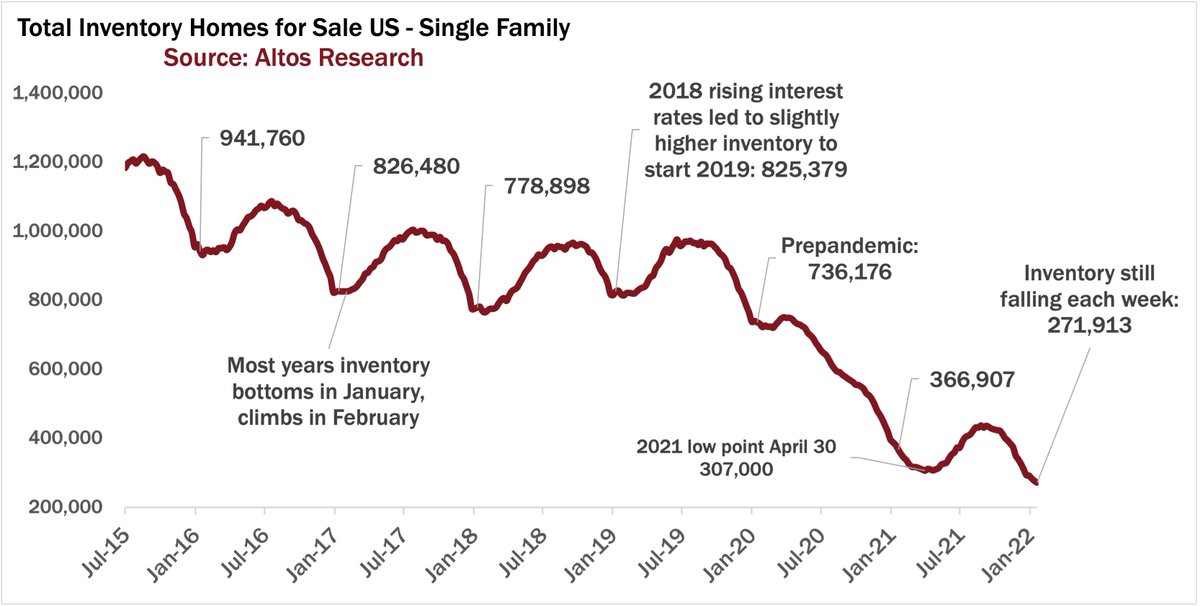
Normally now is the low point of inventory for the year.
But as last year, with almost 2% decline in inventory to 272,000 single family homes, we're not there yet.
The @AltosResearch weekly 🧵📽️👇
1/7
Normally now is the low point of inventory for the year.
But as last year, with almost 2% decline in inventory to 272,000 single family homes, we're not there yet.
The @AltosResearch weekly 🧵📽️👇
1/7
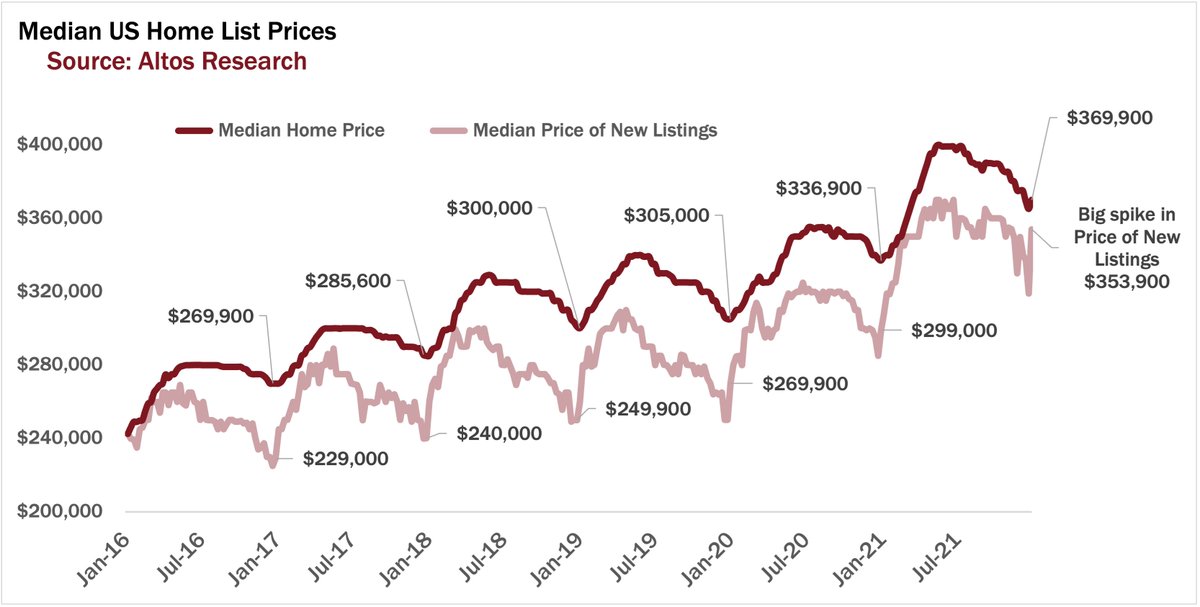
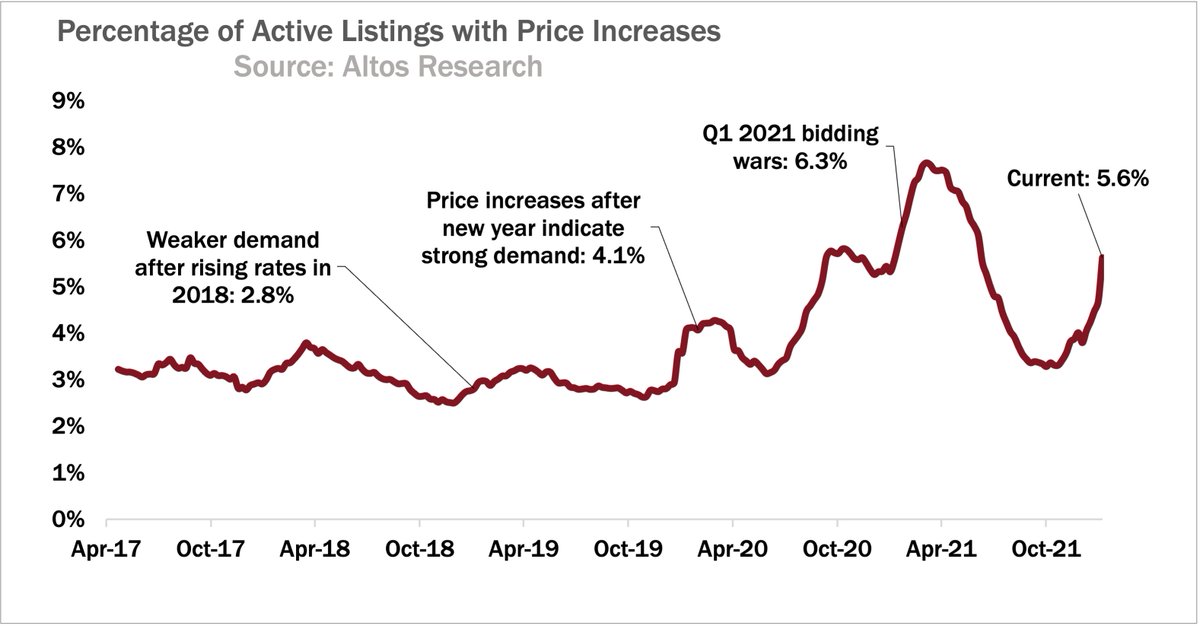
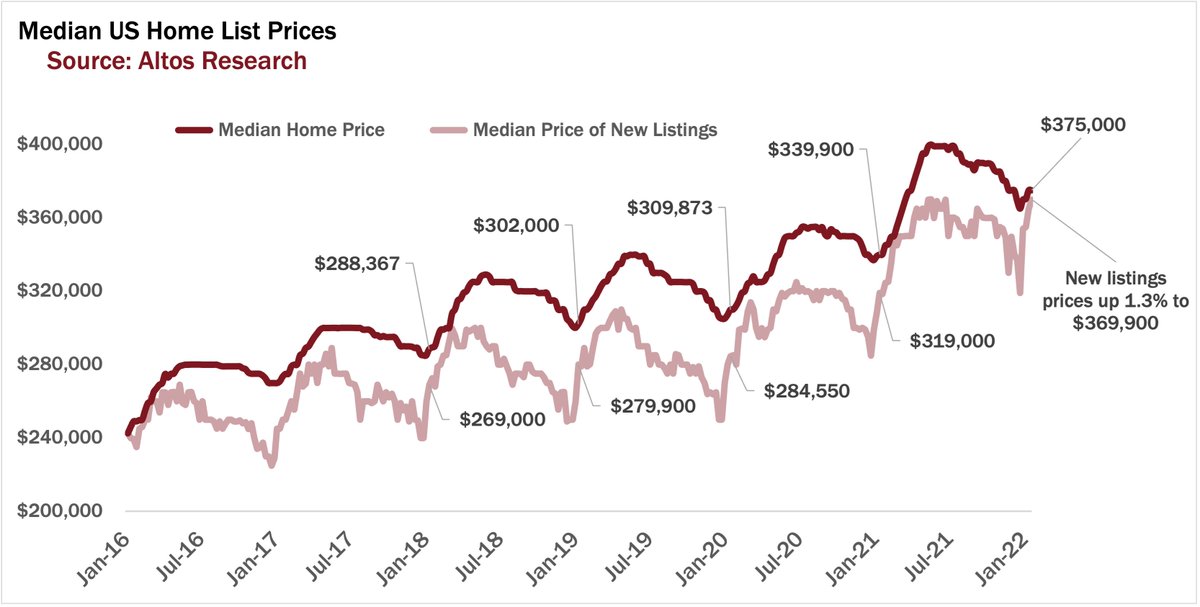
The leading indicators for sales prices continue to spike too. The median price of the newly listed homes (light red line here) this week jumped 1.3% to $369,900.
That tells us that future transaction prices will continue to be 10-12% or more higher for 2022.
2/7
That tells us that future transaction prices will continue to be 10-12% or more higher for 2022.
2/7
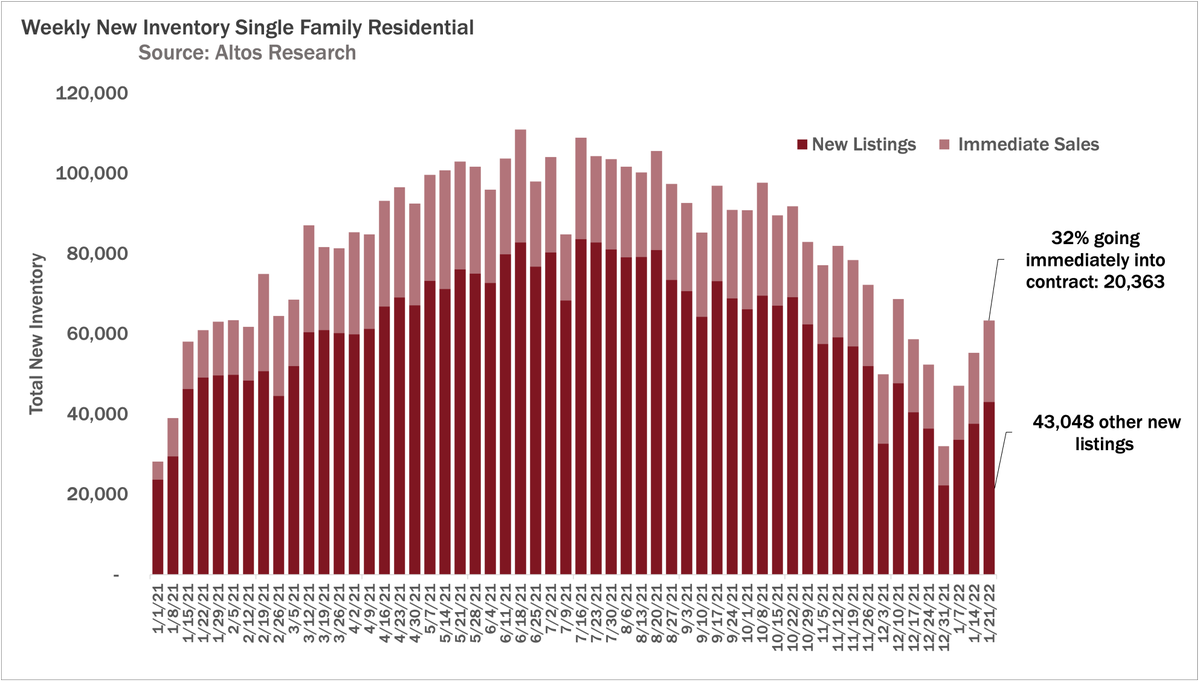
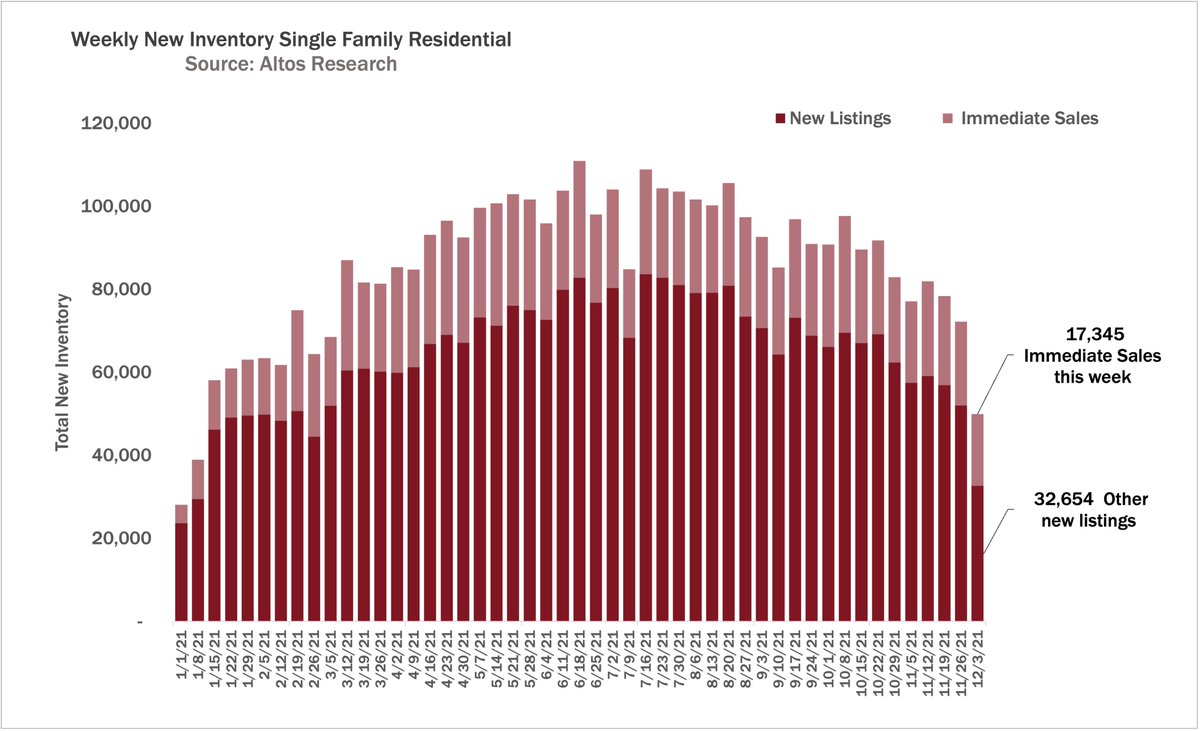
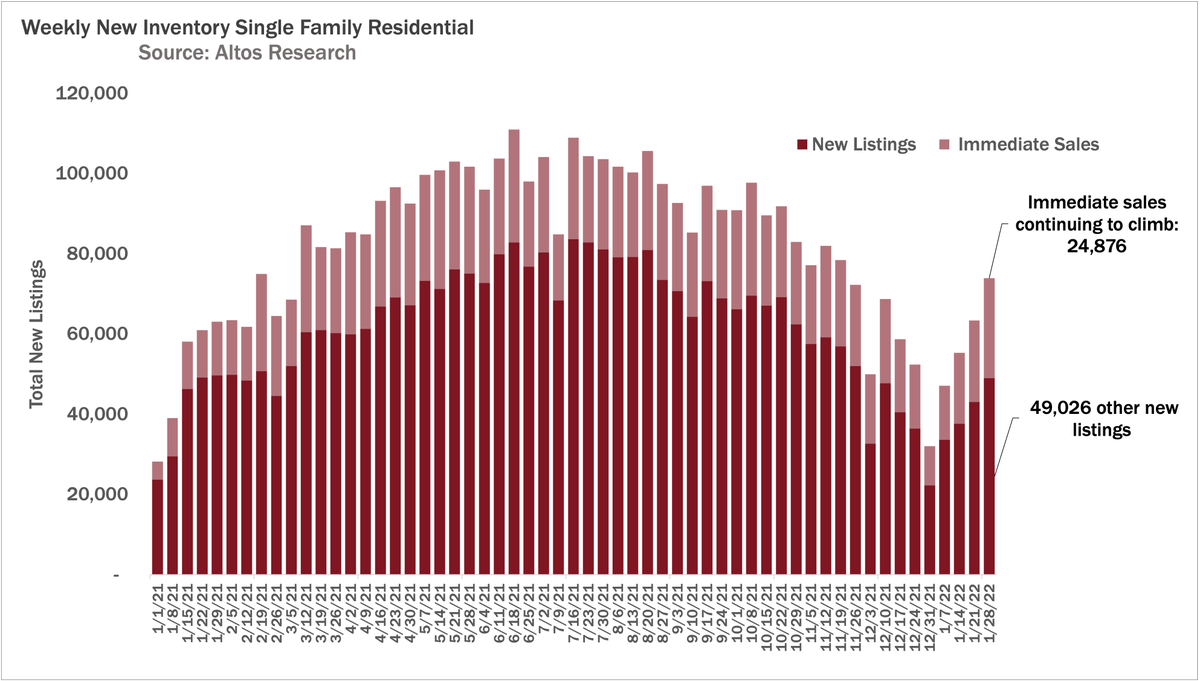
Immediate Sales as a percentage of the new listings continues to grow. A third(!) of the new listings that hit the market this week went into contract immediately. See the light portion of each line grow each week (right end of this chart)
3/7
3/7
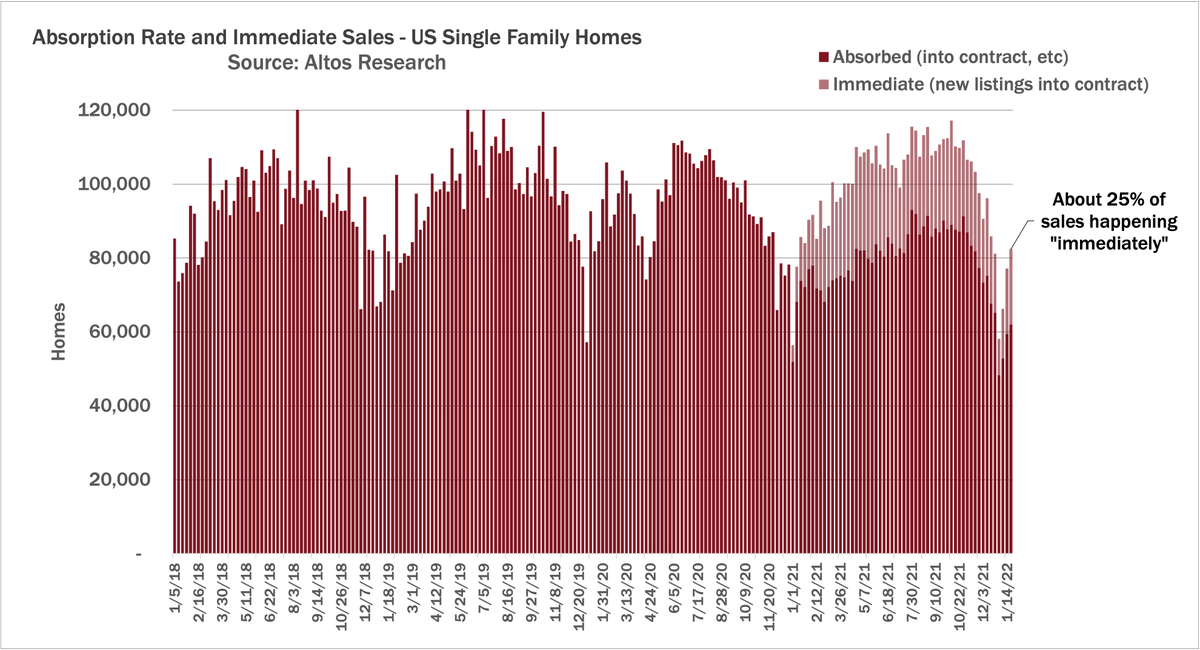
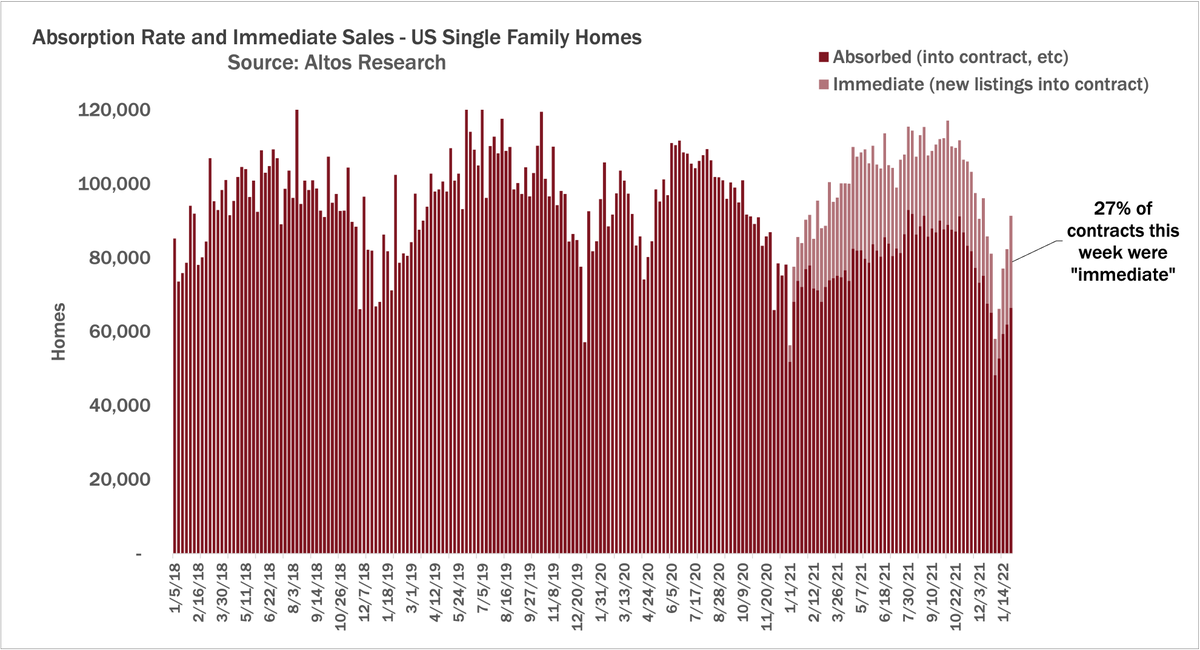
Immediate sale are new listings and new sales (contracts) in the same week.
As a proportion of the new contracts, the immediate sales keeps growing too. 27% of all the deals were immediate.
4/7
As a proportion of the new contracts, the immediate sales keeps growing too. 27% of all the deals were immediate.
4/7
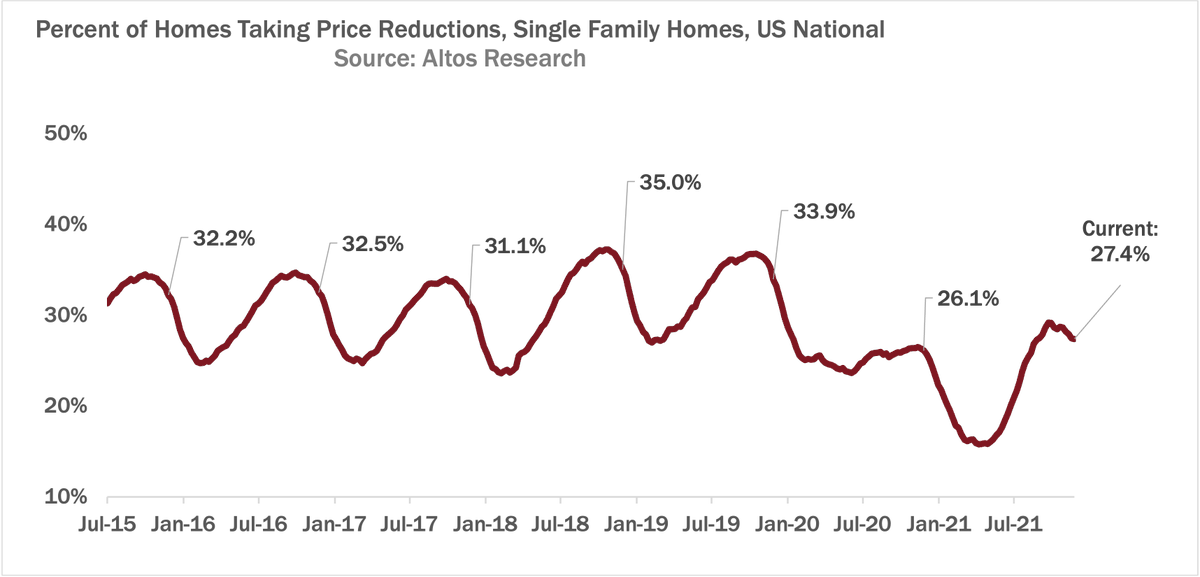
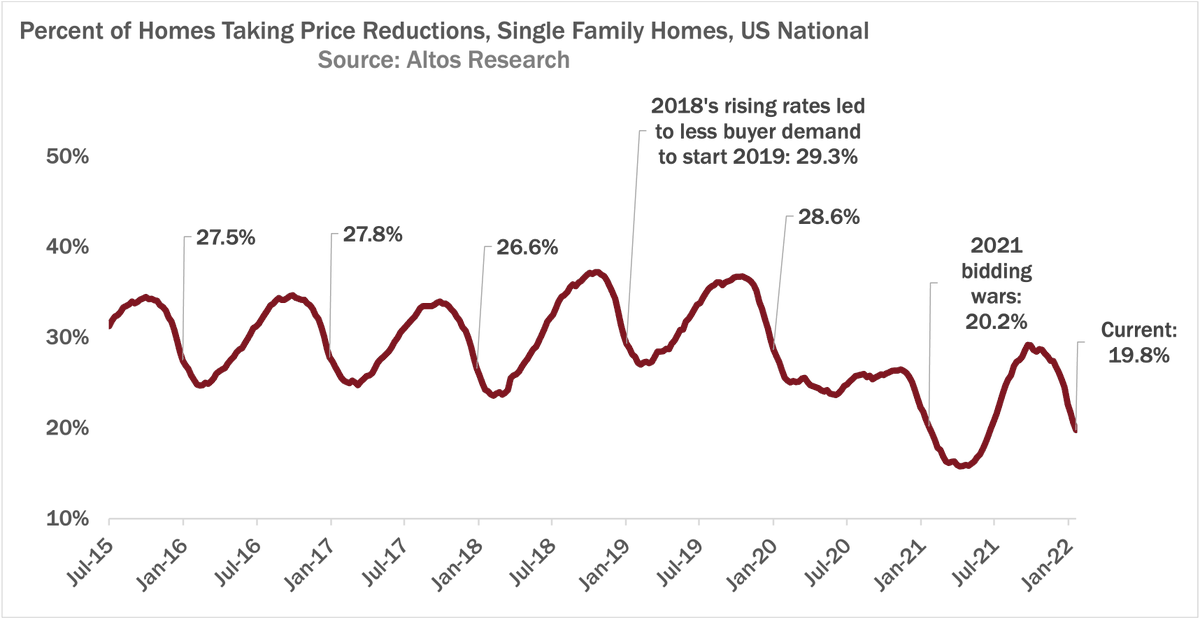
Pricing strength shows up in our price reductions stat too. Only 19% of the homes on the market have taken a price cut. Lower than last year(!) and way lower than normal.
This tells us prices will stay elevated for future transactions.
5/7
This tells us prices will stay elevated for future transactions.
5/7
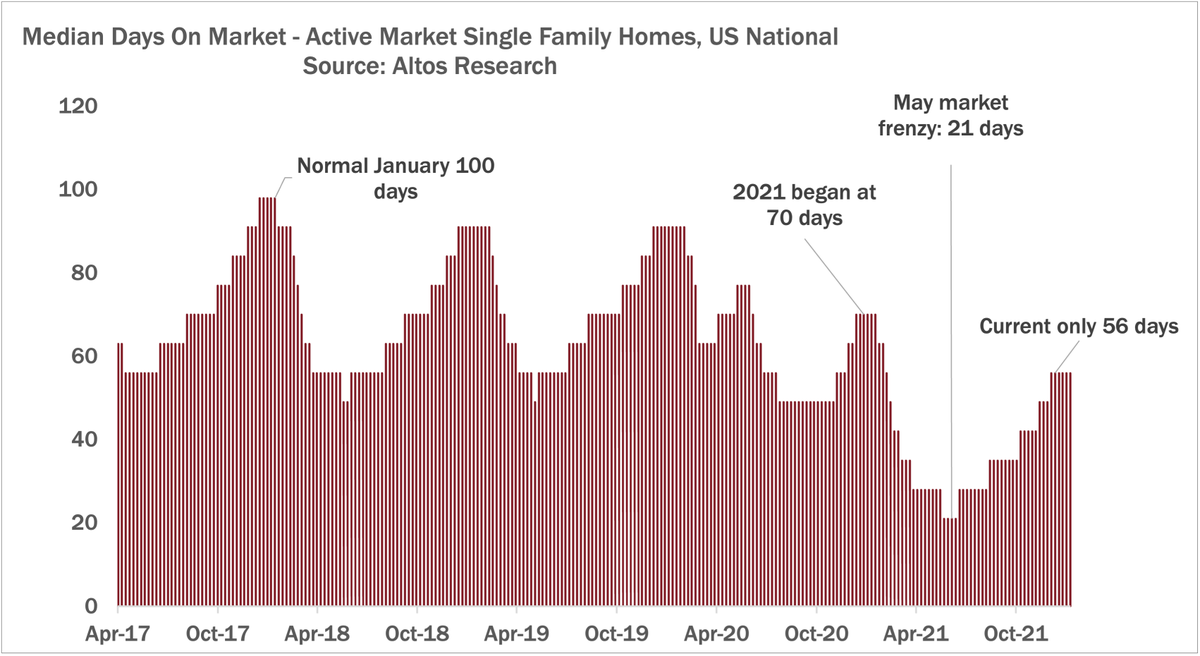
Market time is starting the year at record low. DOM only falls from here. Median DOM is 56 days. Even the most expensive homes in the US ($1Mil +) are moving quickly, DOM falling fast.
6/7
6/7
Full details in the video.
Housing Inventory - How Low Can We Go?
7/7
Housing Inventory - How Low Can We Go?
7/7
The post on the Altos Research blog has the transcript and details for this week's video.
blog.altosresearch.com/housing-invent…
8/7
blog.altosresearch.com/housing-invent…
8/7
• • •
Missing some Tweet in this thread? You can try to
force a refresh