Alastair Thompson Profile picture
Feb 1 12 tweets 5 min read
Stormy Weather.

A thread looking at the first month of 2022 from a very zoomed out perspective. A series of 30 day animations of satellite imagery from @NASA Worldview.

We begin in the South West Indian Ocean which is currently being monstered by a new Cyclone Alley.
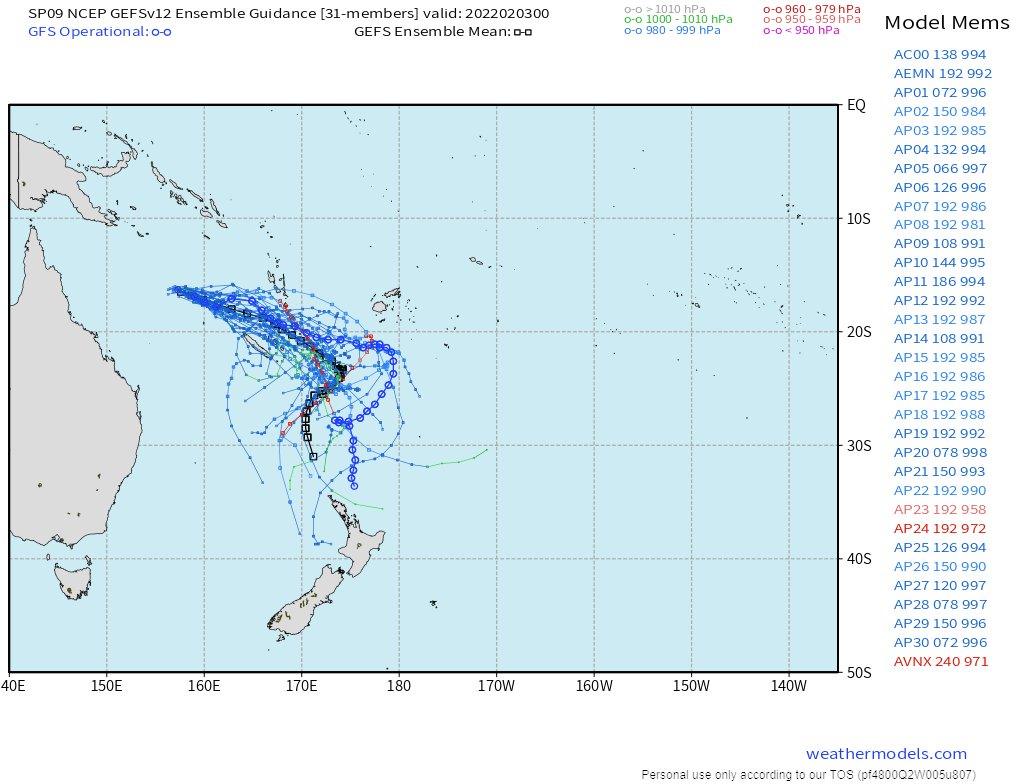
@NASA Next stop the South West Pacific which has had several Cyclones, but thankfully none making landfall in NZ. << touch wood >>.
@NASA Staying mostly in the Southern Hemisphere we now look at South America and the extraordinary Amazon Basin which has experienced record flooding and had a remarkable impact this winter on both North and South Africa producing massive atmospheric rivers to the NE and SE.
@NASA In the Northern Hemisphere we begin in the North Western Indian Ocean and travel East. Here we see the Indian Subcontinent, Central Asia, the Himalayas and Western Pacific.

In both the Northern and Southern Hemisphere (except in the tropics) the flow of water is West-East.
The Tropical and North Pacific.... the largest expanse of Ocean on the Planet & source of a very large portion of the world's atmospheric moisture.
Nth. America's weather patterns this January were driven in large part by flows of Pacific and water south eastwards from the Pacific and north eastwards over Mexico, where they joined tropical water flows from the Tropical Atlantic and Amazon producing a series of bomb cyclones.
Europe has also had a stormy winter as these two sources of water joined over the North Atlantic and then proceeded Eastwards and South Eastwards where they had a significant impact on weather in the Middle East.
In the above animation you can see there was a brief period of fairly clear air over Europe in Mid January when the North Atlantic was less effected by tropical water flows, but that period of relative calm is now over.
North Africa and the ME was where this effort of climate observation began last year and in January focussed on Sahara water transport which produced a series of spectacular rain events over the Middle East.
The data set overlays used for this thread are provided by a new service provided by @NASA's enhanced geostationary satellite service which has an open data set of satellite images of the planet dating back to 2000. worldview.earthdata.nasa.gov
This can be accessed by clicking on the highlighted square (highlighted in yellow) top left when you open the home page.
/ENDS

@Threadreaderapp unroll.

• • •

Missing some Tweet in this thread? You can try to force a refresh
 

Keep Current with Alastair Thompson

Alastair Thompson Profile picture

Stay in touch and get notified when new unrolls are available from this author!

Read all threads

This Thread may be Removed Anytime!

PDF

Twitter may remove this content at anytime! Save it as PDF for later use!

Try unrolling a thread yourself!

how to unroll video
  1. Follow @ThreadReaderApp to mention us!

  2. From a Twitter thread mention us with a keyword "unroll"
@threadreaderapp unroll

Practice here first or read more on our help page!

More from @althecat

Feb 3
This is the UK-Met model's solution at 120 hours. As the AccessG model is associated with the UK-Met model (which only runs for 144 hours) for this reason I am discounting it in this scenario. The ECMWF and GFS models are the two tropical phenomena specialist models. Image
Here we see the ECMWF models 120-240 hour prognostication.
And here's the GFS 120-240 hour prognostication.

The main difference at the starting point is that the GFS is expecting four lows two strong & two weak and this results in a sharply different outcome.
Read 9 tweets
Feb 3
Spaghetti model simulations of several tropical storms currently north west of NZ are not looking at all good.

The possibility of a cyclone coming into the Tasman and making landfall on NZ's West Coast is now non-zero. Image
The above map is the European ECMWF ensemble map for the area. This specific model map is for SPO9 a designated disturbance/low pressure system of concern.

Until very recently the models had suggested it would be pulled away to the East of NZ - which is what typically happens. Image
In this region we have four different models (GFS-US, ECMWF-Euro, AcessG-AU and CMC-Canada) each of which has a different solution on how this will play out.

But the trend is in the direction of a threat to NZ. Each of these plots show the water/energy modelling for around 12/2. ImageImageImageImage
Read 7 tweets
Feb 3
Very Intense Cyclone Batsirai #ExtremeWeather Update 4. 3/2/21

#Batsirai has slowed down to a crawl, it has been moving WSW at 5mph (7kmh) for the past 17 hours at least. It is also wobbling and weakening. But the current official forecasts do not reflect this WRT to landfall. ImageImage
This is common for an EWRC [Eye Wall Replacement Cycle], after which the storm can be expected to strengthen rapidly. #Batsirai's eye is certainly now very ragged. (images here used to verify speed and heading data). It appears the track is to the north of the current forecast. ImageImageImage
The much larger eye indicated in the latest imagery is still full of cloud, and it appears the EWRC is complete. ImageImage
Read 13 tweets
Feb 2
Update Thread:

#ExtremeWeather #Madagascar #Batsirai #CycloneBatsirai

Intense Cyclone Batsirai has strengthened rapidly and grown significantly larger. It has now passed Mauritius and its outer bands are now over Reunion.
Madagascar is 1000kms long top to bottom and #BatsiraiCyclone's outer bands are roughly the same size. With sustained winds of over 113 knots the storm is now the equivalent of a Category 4 Major Hurricane. Image
The JTWC's latest forecast track update #13 shows the storm maintaining very intense cyclone intensity up to landfall (of the eyewall - maximum strength winds) in the morning on Saturday. Rain and high winds will arrive on Friday. Image
Read 12 tweets
Feb 1
A satellite view over NZ this morning. Two massive atmospheric rivers are colliding over the Tasman sea and delivering rain in massive quantities over the South Island.
Zooming in to the satellite imagery we can see that this stream of clouds is a massive area of convective thunder storms sweeping in from the North.
This version incorporates radar rain data, all the loops are for six hours as the sun rises.
Read 8 tweets
Feb 1
Here's your problem Kiwis. A persistent atmospheric river running for the next 111 hours across most of the country.
And after that you may or may not get hit by a moisture laden Northerly Storm/Cyclone.
16 day atmospheric water forecast.

You can chalk this up to #ClimateChange.
Read 8 tweets

Did Thread Reader help you today?

Support us! We are indie developers!


This site is made by just two indie developers on a laptop doing marketing, support and development! Read more about the story.

Become a Premium Member ($3/month or $30/year) and get exclusive features!

Become Premium

Don't want to be a Premium member but still want to support us?

Make a small donation by buying us coffee ($5) or help with server cost ($10)

Donate via Paypal

Or Donate anonymously using crypto!

Ethereum

0xfe58350B80634f60Fa6Dc149a72b4DFbc17D341E copy

Bitcoin

3ATGMxNzCUFzxpMCHL5sWSt4DVtS8UqXpi copy

Thank you for your support!

:(