This week's Top of Mind podcast from @AltosResearch is a real treat!
I spent an hour with the one and only Bill McBride of @calculatedrisk. Bill's been a premier commentator on the US real estate market for nearly 20 years. Quick thread on the big ideas we covered:
🧵👇
1/5
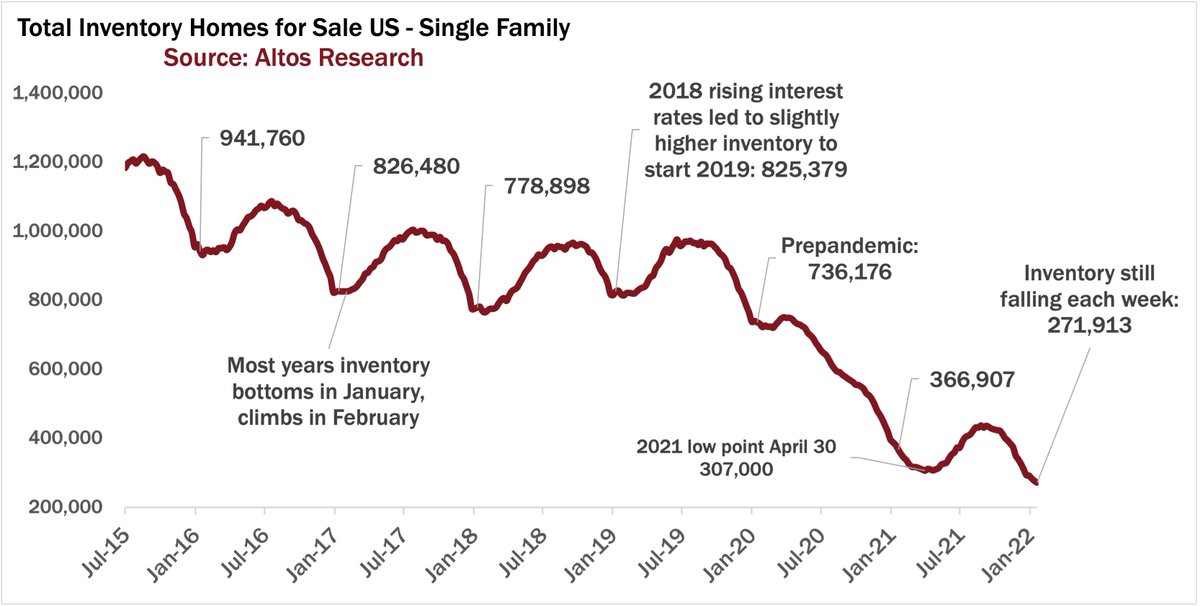
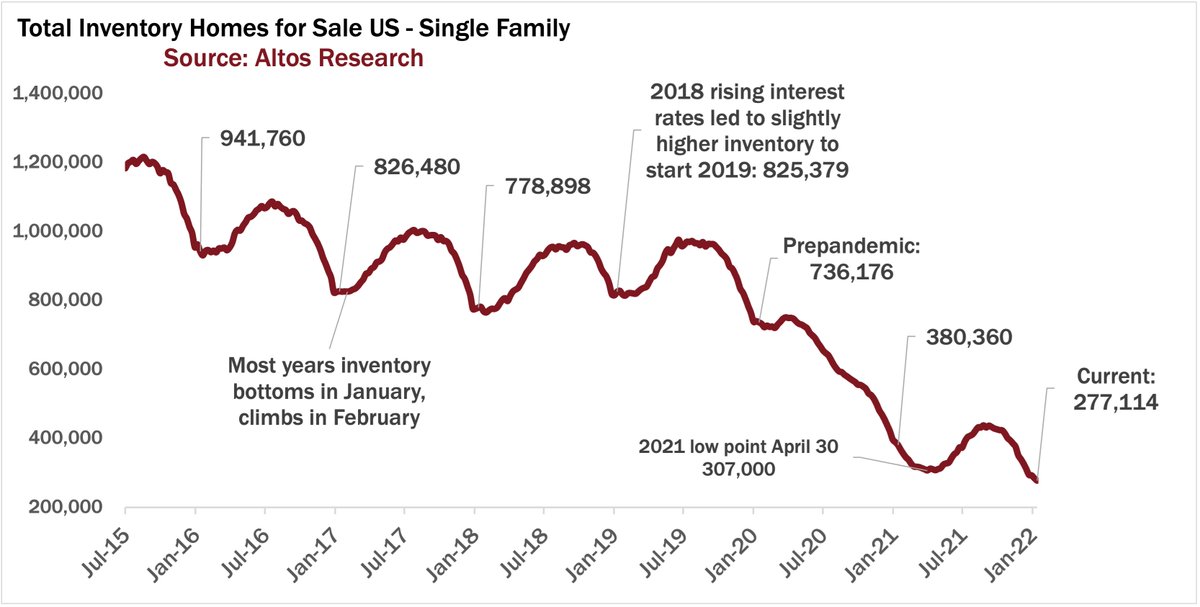
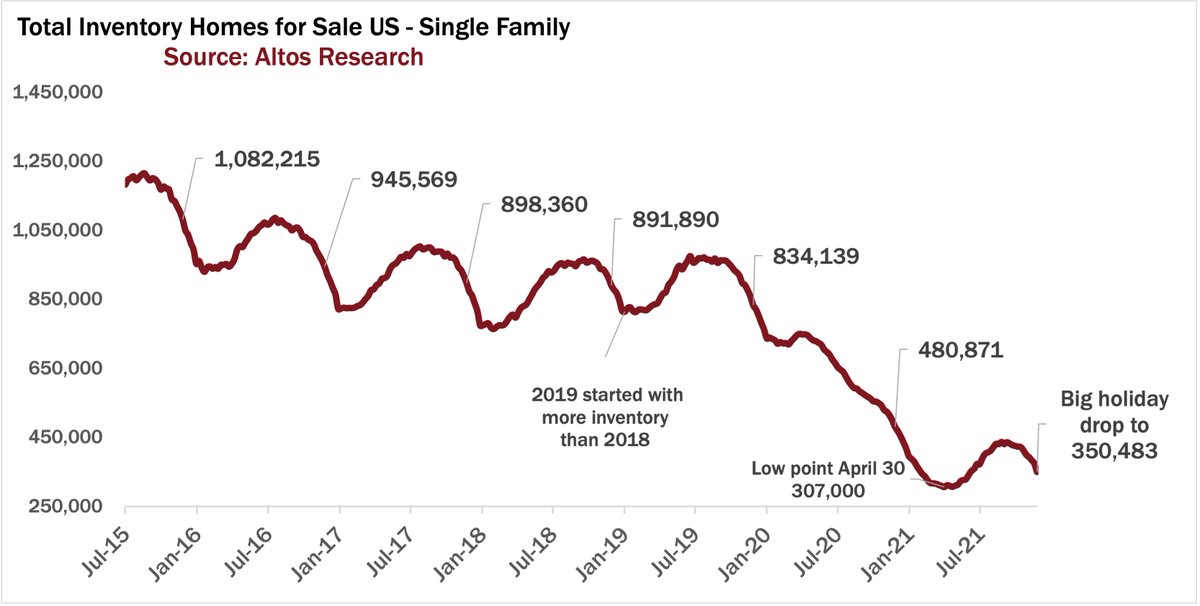
I was peering into Bill's brain to look for risks that might derail this crazy US housing market. What am I missing?
Bill has a great hypothesis on where we should look for risks. Hint: 🏘️🏘️🏘️🏘️
2/5
We talked demographics. Bill has been trying to show us for 10 years, the coming Millennial wave. It's why household formation is spiking.
Bill gives us a great framework for planning the next decade of demographics in US real estate. The Next Big Shift.
👶-->👴
3/5
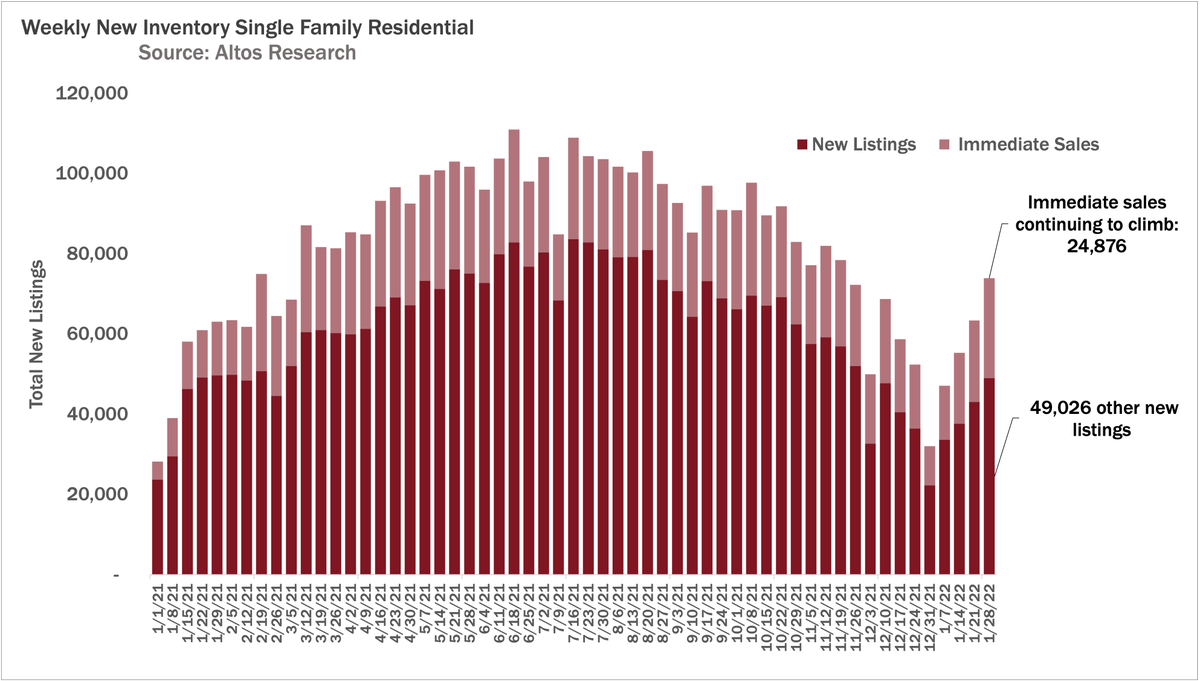
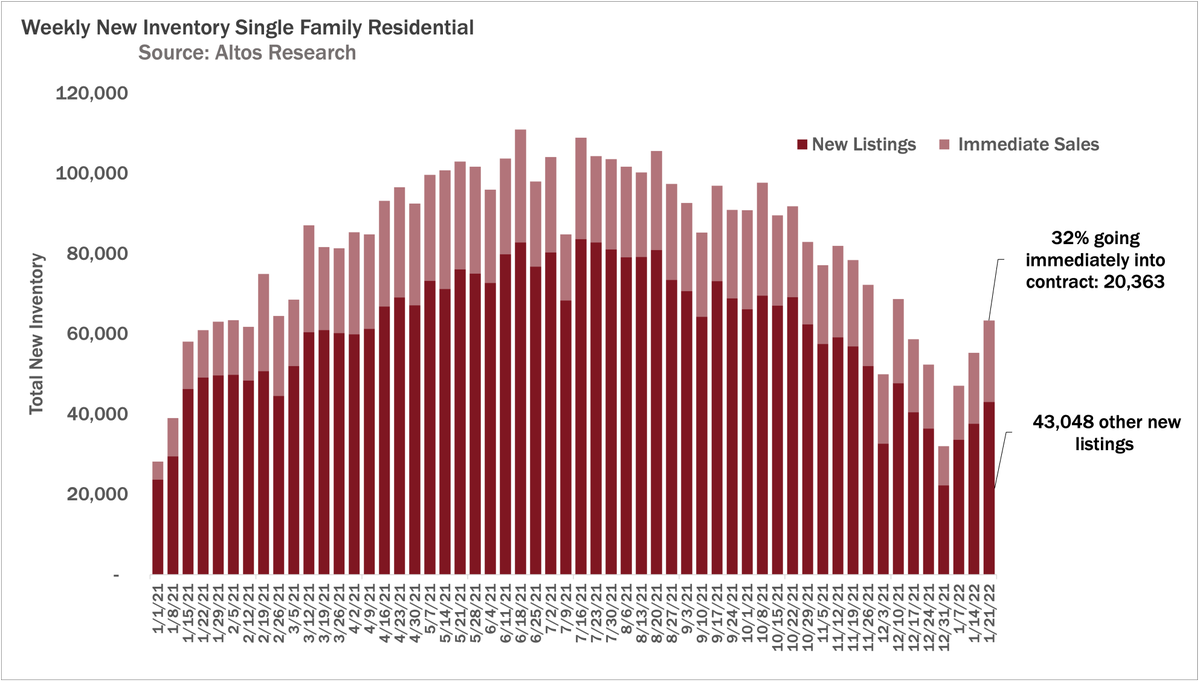
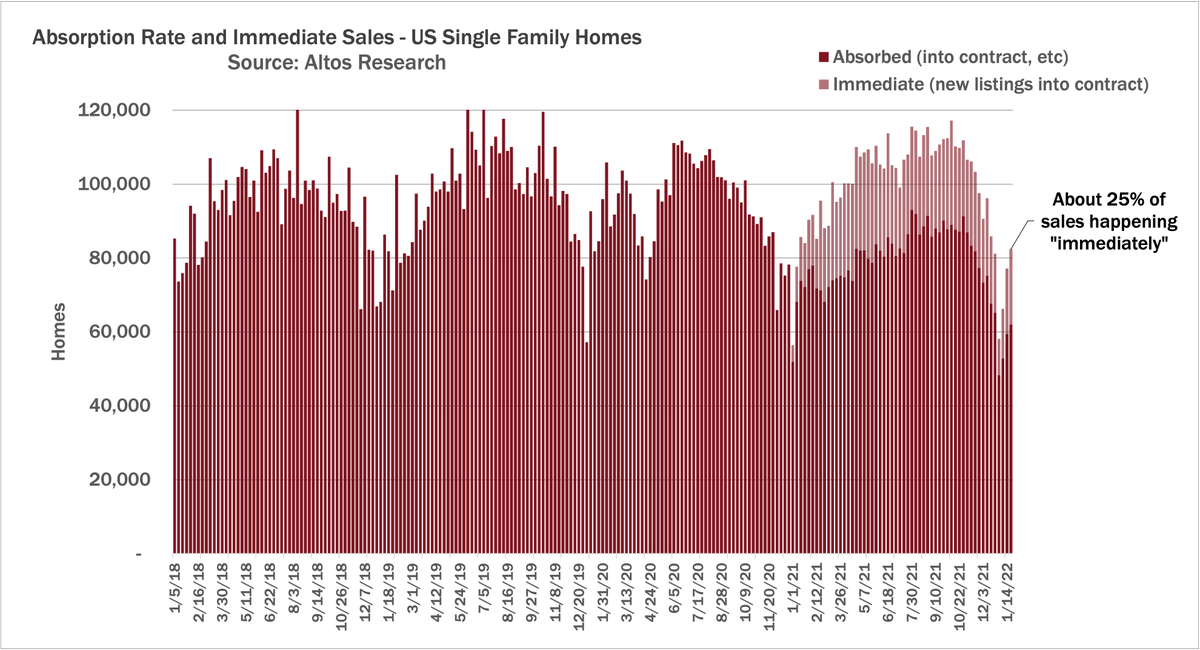
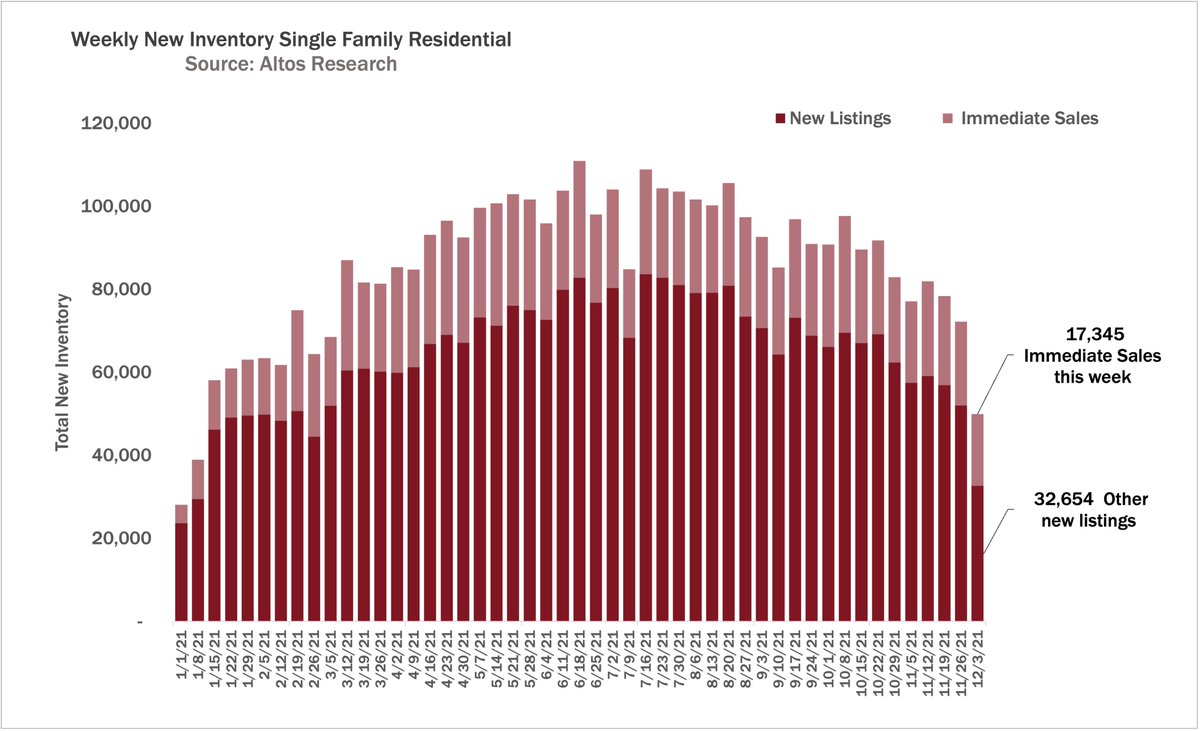
We talked about the "immediate sales" phenomenon and pocket listings and the impact on the consumer.
💸💸💸
4/5
Full transcript plus all the links to your favorite podcast apps are on the Altos blog.
Don't miss the inimitable, Bill McBride @calculatedrisk on this week's Top of Mind podcast!
The leading indicators for sales prices continue to spike too. The median price of the newly listed homes (light red line here) this week jumped 1.3% to $369,900.
That tells us that future transaction prices will continue to be 10-12% or more higher for 2022.
2/7
Immediate Sales as a percentage of the new listings continues to grow. A third(!) of the new listings that hit the market this week went into contract immediately. See the light portion of each line grow each week (right end of this chart)
Volatility in stock and crypto markets not enough to slow housing (yet). Here's what we can see in the data - this week's @altosresearch 📽️🧵👇
Available inventory of unsold single family homes fell by 2.4% this week to only 277,000 homes on the market. New record low.
1/7
The percentage of new listings that are going into contract essentially immediate is climbing(!) up to 32% this week. Nuts.
2/7
Since those immediate sales are both new inventory AND new sales in the same week, here's the other view. Immediate sales are 25% of all those going into contract this week. (We started tracking immediate sales last year.)
The big news is how fast the Price of the New Listings jumped this week (light red line here). PNL captures what sellers already know about demand in their market.
This year's jump is higher, faster than we expected.
These are prices for *future* transactions.
2/6
Another leading indicator: Price increases for homes that we saw on the market last fall. Compare to January of 2019 after a year of rising rates in 2018, price increases were muted with demand.
Price increases are spiking again like last year. 🔥😮
Prepare for bidding wars 3/6
Help me flesh out (and name) a phenomenon I'm observing?
Postulate: In the social media universe, ALL political/social positions must evolve to where both sides can look at the same underlying data and claim justification.
example 1: covid data. Infection and death rates are evidence that...
A) We have had too many protections and restrictions
or
B) Protections and restrictions have been justified
example 2: inflation. The current inflation rate is evidence that...
A) we're overspending, panic
or
B) we're solving problems, celebrate
Surprise! Inventory of homes for sale is actually falling faster than expected for this time of year.
Down to just over 400,000 single family homes on the market. Inventory fell by 3% this week.
This week's thread and video with the #altosresearch real estate data
🧵👇 1/6
Demand is staying elevated even as supply shrinks for the holidays. One place to see that is in our Immediate Sales tracker. Still 25% of the new listings of homes for sale are going into contract essentially immediately each week, even as total volume ticks down.
2/6
Another place to see demand strong relative to supply is in the Altos Research Market Action Index. See how the readings have actually been ticking up this fall, when normally they'd be flat to down.