Orwell2024 Profile picture
Feb 3 10 tweets 5 min read
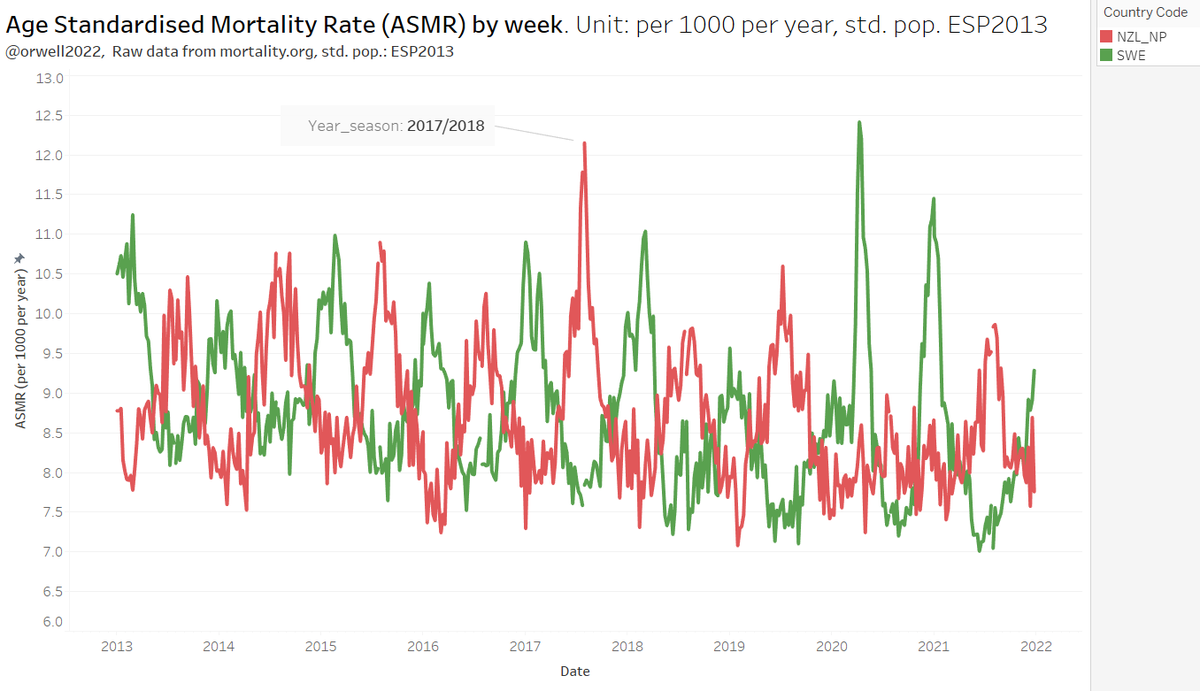
1/ Let's do another ASMR match race:

🇳🇿New Zealand - 🇸🇪Sweden.

Those have very different locations (mild versus hostile climate) and are shifted in seasonality by 6 months.

Respiratory diseases follow seasons. They always have, despite the denial by @c_drosten et. co.
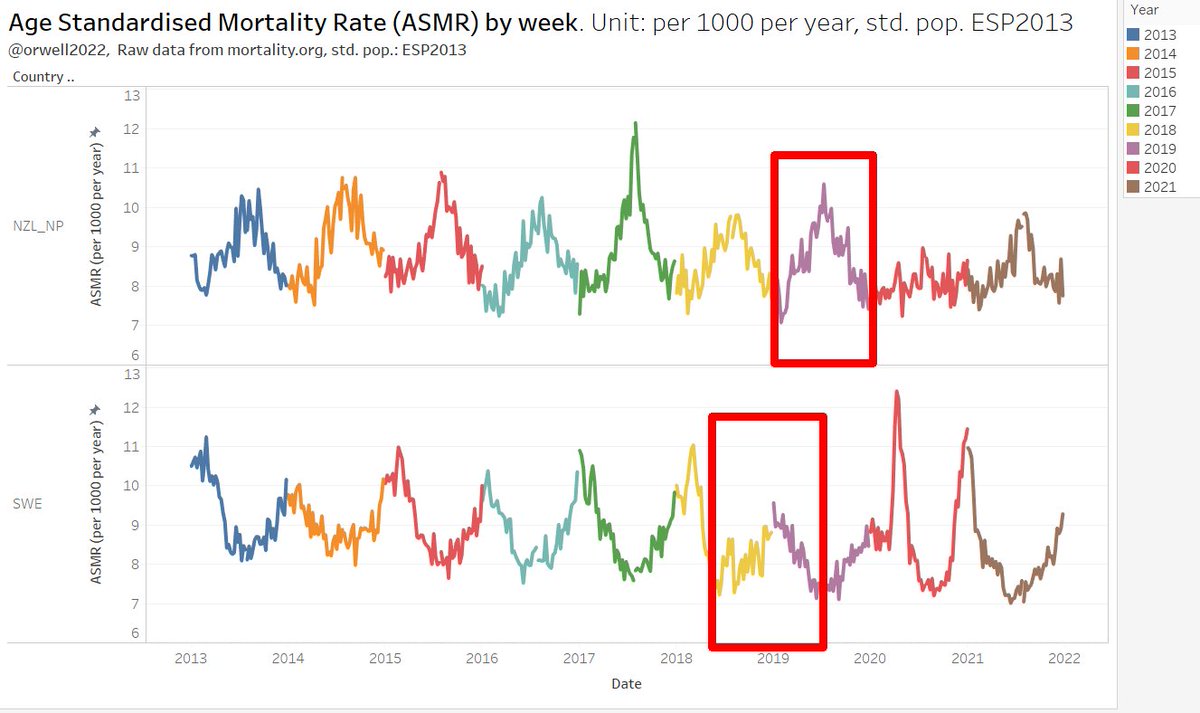
2/ The seasonality becomes even clearer when showing this by calendar weeks.

The inclination of the earth makes this happen: Seasons.

Season modulate UV light exposure, temperature and humidity. Those drive respiratory diseases. Main parameter: UV.
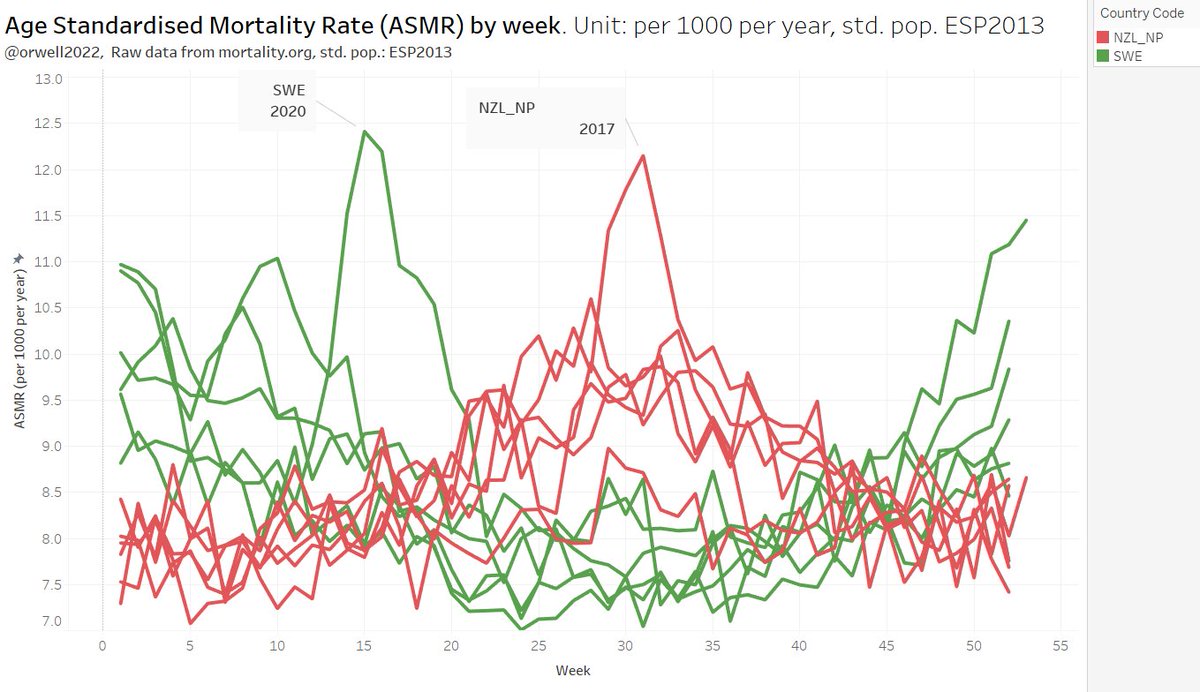
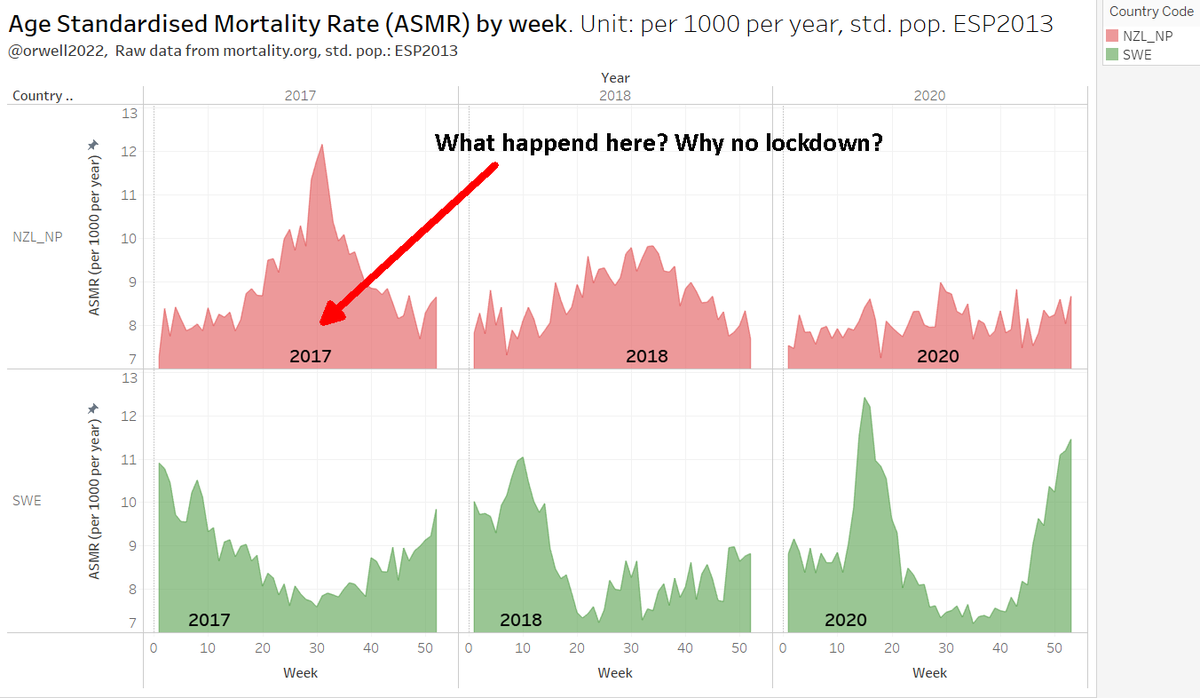
3/ Notice the heavy seasons 2017 in New Zealand.

Why was there no general panic? Does the NZ Covid response appear rational when comparing with Sweden in 2020?

No. But we know this.
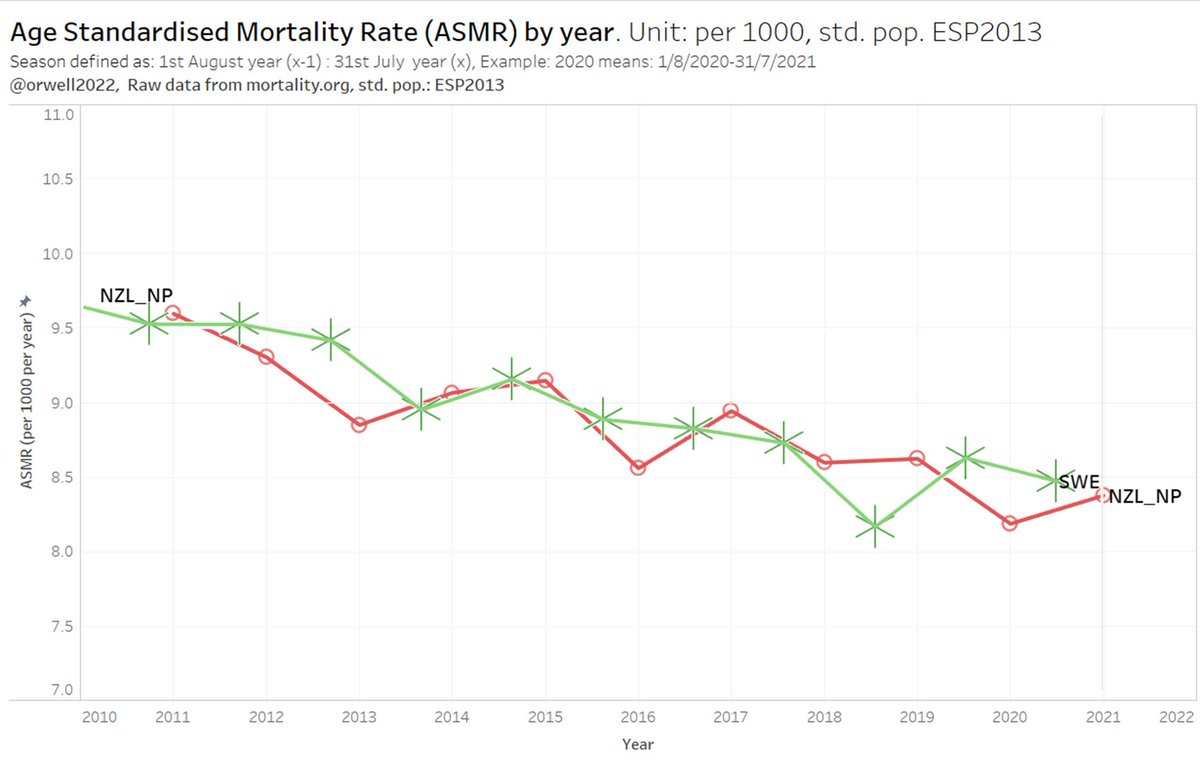
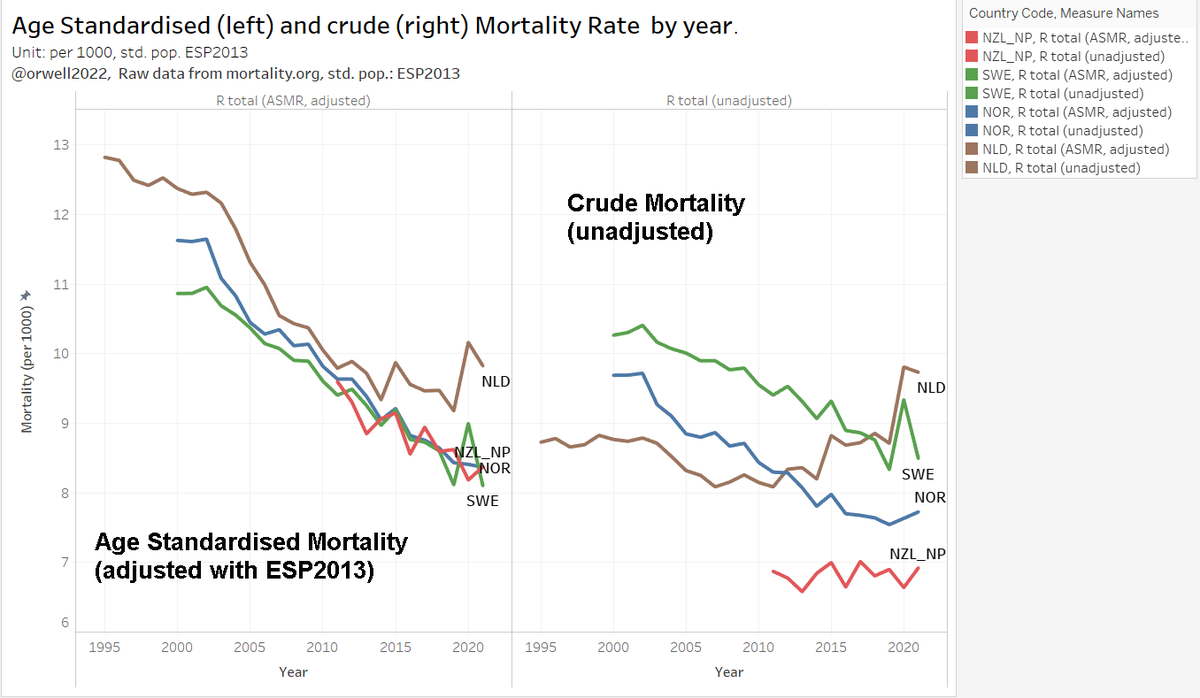
4/ This is how the yearly ASMR trend looks like.

For new Zealand, the calendar year is also the natural flu season year. For Sweden, we would need to shift the date by 6 months. We will do that, but first here the calendar comparison.
5/ For new Zealand, the calendar year is the natural flu season year. For Sweden, we would need to shift the date by + or - 6 months. Backward is likely better, as diseases will start in the northern hemisphere. NZ will probably lag in every season (they get it last).
6/ So comparing north and south hemisphere gets a bit tricky when using date aggregation. But some classic MGMT style PowerPoint engineering (and transparent colours) works wonders here. PPT is the main MS product, that I really like.😅

SWE is green, NZ red here.
7/ Summary: It doesn't make any sense what NZ is doing. The direct comparison with Sweden, a country located in a challenging climate with respect to seasonal diseases, shows this clearly.

NZ: stop the absurd Covid response.
8/ Find here the extended substack version which includes some words about the record flu season 2017 in NZ.

orwell2024.substack.com/p/new-zealand-…

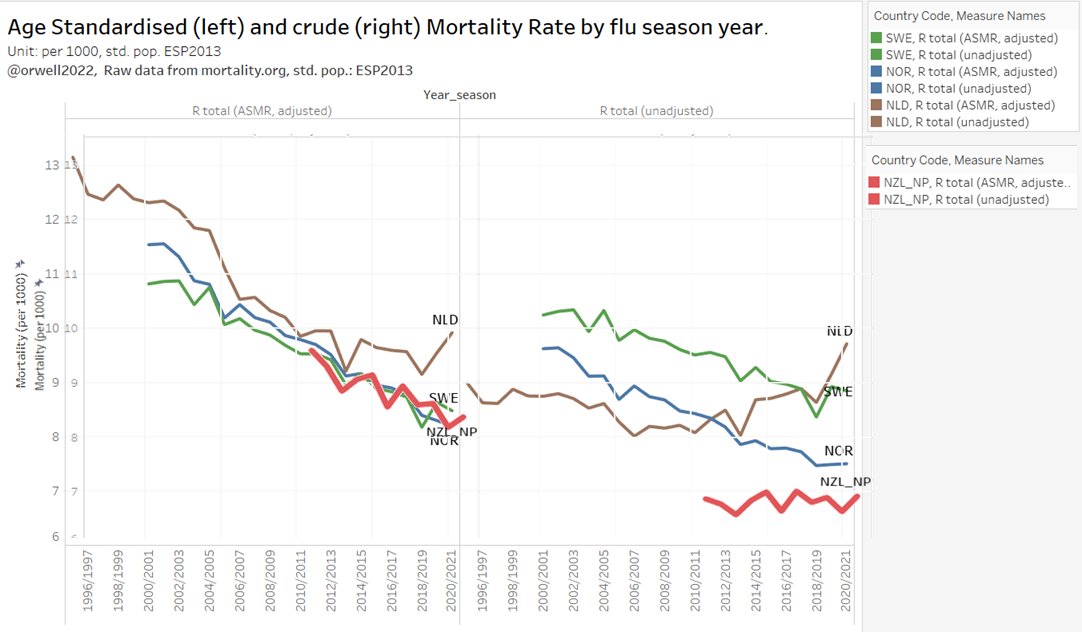
9/ Update - added a demo to show the effect of ASMR versus crude mortality. It's in particularly visible for NZ.

On the left we see the ASMR (Age Standardised Mortality) and on the right the crude mortality as taken from source (mortality.org).
10/ We can do this by season after applying some classic PPT overlay engineering and the use of transparent ink.

The substack articles have been updated as well.
• • •

Missing some Tweet in this thread? You can try to force a refresh
 

Keep Current with Orwell2024

Orwell2024 Profile picture

Stay in touch and get notified when new unrolls are available from this author!

Read all threads

This Thread may be Removed Anytime!

PDF

Twitter may remove this content at anytime! Save it as PDF for later use!

Try unrolling a thread yourself!

how to unroll video
  1. Follow @ThreadReaderApp to mention us!

  2. From a Twitter thread mention us with a keyword "unroll"
@threadreaderapp unroll

Practice here first or read more on our help page!

More from @orwell2022

Feb 1
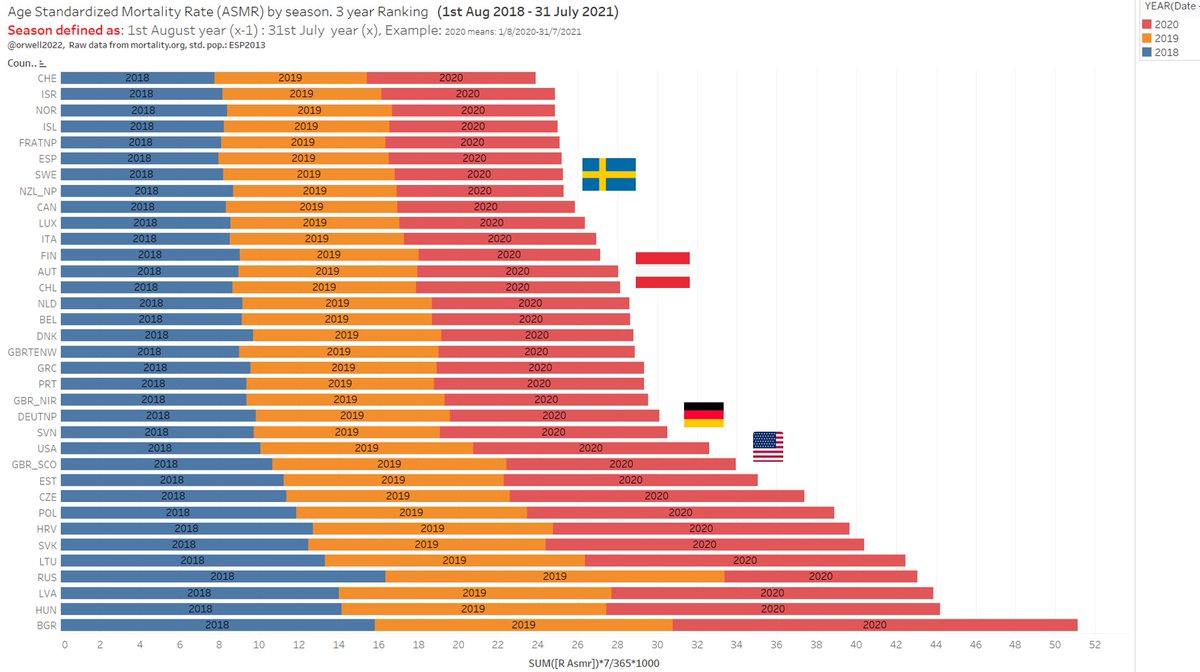
1/ Mortality ranking update.

Find here a graph that includes more countries.

This time using mortality.org raw data to calculate the Age Standardised Mortality Rate (ASMR).

2019 means 1st Aug 2019 - 31st July 2020.
2020 means 1st Aug 2020 - 31st July 2021.
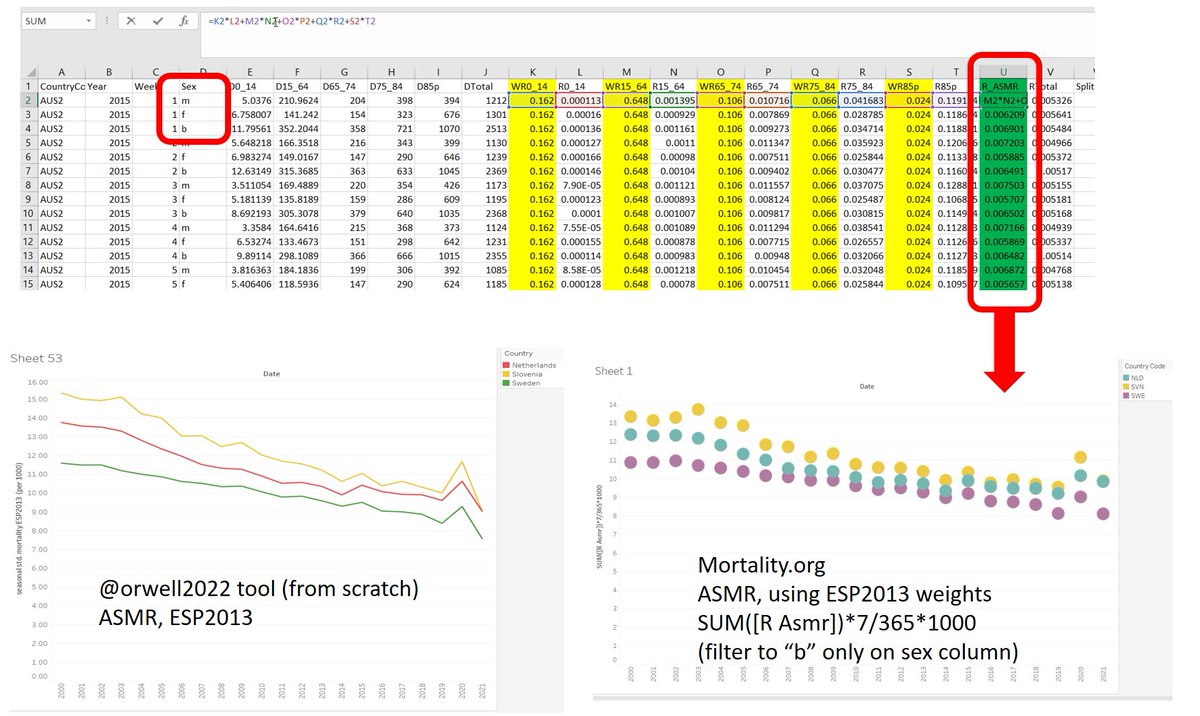
2/ Using mortality.org as source is less accurate as only one large 15-64 bin is available for this band. That creates a bias which underestimates the ASMR. For emerging countries (life expectancy <65), such a large bin is far too wide.
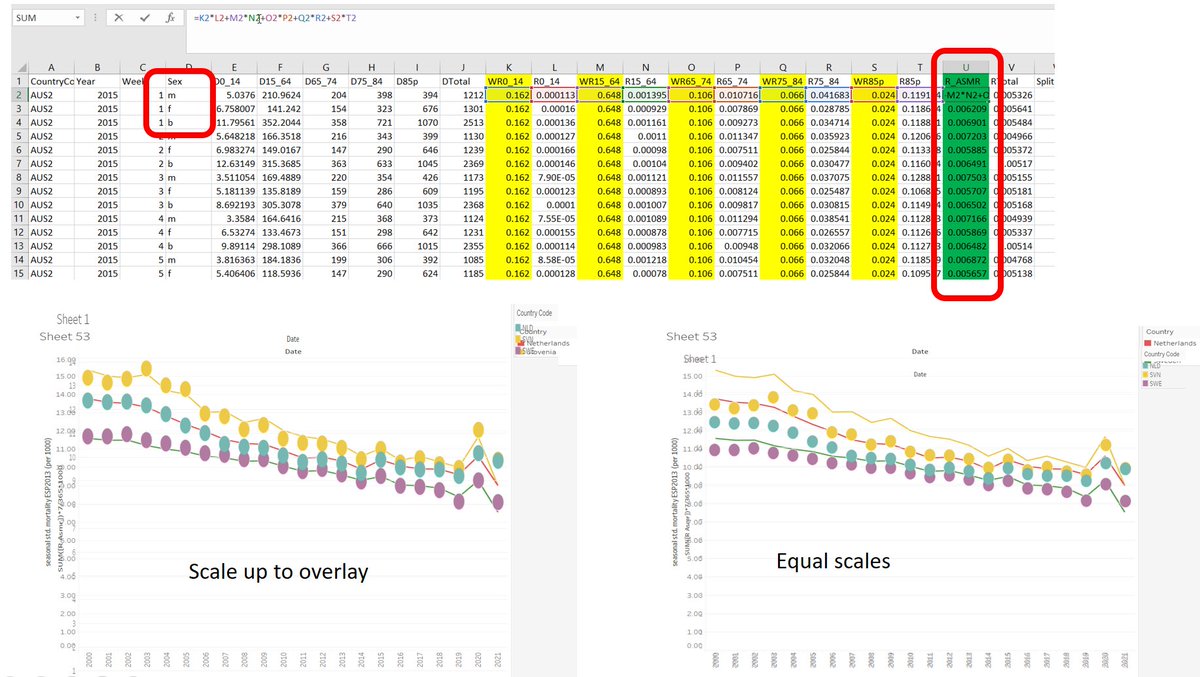
3/ The overlay shows effect. Standardising with large bins, creates a bias which underestimates the ASMR.

What we did here
orwell2024.substack.com/p/age-adjusted…
is therefore more accurate as done on 5 year bins systematically.
Read 9 tweets
Jan 26
1/ Dear @rubenivangaalen: find here a more revised version on mortality.

Some questions first:

1) Is excess or the ASMR baseline more important?
2) Averages or trends (which mortality.org is conveniently offering?), what is better?

orwell2024.substack.com/p/netherlands-…
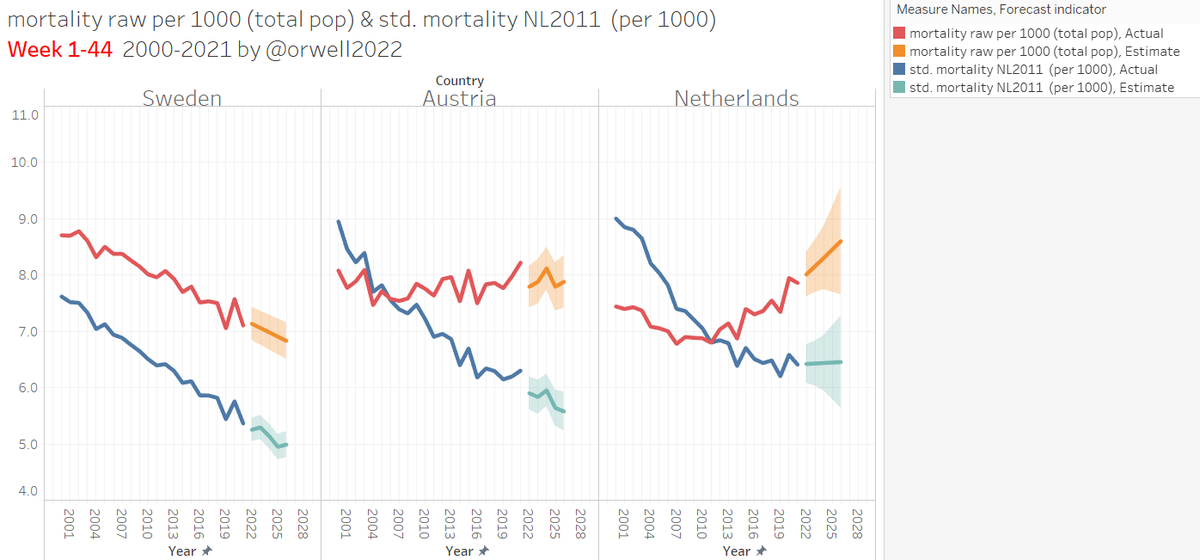
2/ Dear @rubenivangaalen: why is NL having a high ASMR baseline compared with Sweden?

Why is NL infant mortality trend and baseline looking so bad?

Is it normal for such a country like NL?

orwell2024.substack.com/p/europe-infan…
3/ Dear @rubenivangaalen: You claim that vaccination is the reason for the low mortality in the north.

But this is the case in other years as well.

How is it possible, that CBS can't see a basic spurious correlation issue?


Read 10 tweets
Jan 26
1/ The first part, explaining @profnfenton findings is good, the 2nd part about excess in Germany is wrong to my view.

1) Sweden, Norway and New Zeeland have no excess despite high vaccination.

New Zeeland:


facebook.com/bystronpetr/vi…
2/ Germany: Going deeper on the which group is dominating the excess, we see mainly 65+. The needed vaxx CFR to make this are beyond any reasonable plausible assumption. Again, many countries directly contradict this (SWE, NO, NZ...)

3/ The needed vaxx CFR to explain excess in 65+ is beyond any reasonable assumption.

1) Theory example: even 1:1k or 1:10k deaths would be burried in noise for the 65+:

2) Real data (~1:90k)
Read 5 tweets
Jan 13
1/ The non reality sides are converging on the harmlessness of lockdowns. 😂

They both have a one parameter explanation where lockdowns do no harm:

A) Covid explains it all
B) Vaxx damage explains it all

"I do not need a number to prove the obvious"
2/ Next one

"We've been through worse than 2 years locked up. We were hungry, we had almost no clothes"

Sure: NL life expectancy
1940: 60-70 y
1920: 82 y

Let's go back to 81 y, 78 y...with lockdowns? Fine? No big deal.
Read 5 tweets
Jan 13
1/ The reactions to this are stunning.

1) The lockdown side sais "Covid" and deny open Sweden, Norway, FL, Amish...

2) The vaxx is doing all cause excess side sais: the "vaxx"and they deny the high vaxx shining Sweden and Norway.

Equal trauma on both sides.
2/ Both sides use confounded non adjusted OWID excess, but mostly no data at all.

One claim is bad batches:

By chance, all lockdown countries had this issue, but not Norway and Sweden with their open approach leaving kids free.
3/ The vaxx side has no issues with fundamental contradictions, like the unrealistic (percent range) fatality rate needed to make such an excess.

We show them a theoretical example: No engagement, but change of topic. Ignore math and exponential mortality basics and continue.
Read 12 tweets
Jan 13
1/ US: Surge In Deaths Among People Aged 18-49.

Note: we don't see this is West Europe (Sweden has under mortality in this age group), but in the East yes.

Why is it bad to follow Sweden? Can we agree that it would be nice to have their outcome?

theepochtimes.com/mkt_app/northe…
2/ Now here the comparison USA - Sweden. Shown are age specific mortality rates for the group 15-64 years.

The 2021 excess in US is drastic. Sweden: under mortality. Also last year Sweden did fine on 15-64. Covid did not do this. Hysteria did. Stop it now!
3/ So let's also show the same age group 15-64 for the great pandemic year 2020 and show how Sweden "failed" (to kill the young) while USA was following the pope of science, Dr. Fauci.

Can you see it? Nothing in Sweden.
Read 4 tweets

Did Thread Reader help you today?

Support us! We are indie developers!


This site is made by just two indie developers on a laptop doing marketing, support and development! Read more about the story.

Become a Premium Member ($3/month or $30/year) and get exclusive features!

Become Premium

Don't want to be a Premium member but still want to support us?

Make a small donation by buying us coffee ($5) or help with server cost ($10)

Donate via Paypal

Or Donate anonymously using crypto!

Ethereum

0xfe58350B80634f60Fa6Dc149a72b4DFbc17D341E copy

Bitcoin

3ATGMxNzCUFzxpMCHL5sWSt4DVtS8UqXpi copy

Thank you for your support!

:(