
🔥 Documenting fires in Myanmar
#WhatsHappeningInMyanmar
Today we look at methods for documenting the burning of civilian structures.
There are several methods we can use to verify that a fire occurred, and then to map that damage.
#OSINT #THREAD
1/35 👇
#WhatsHappeningInMyanmar
Today we look at methods for documenting the burning of civilian structures.
There are several methods we can use to verify that a fire occurred, and then to map that damage.
#OSINT #THREAD
1/35 👇

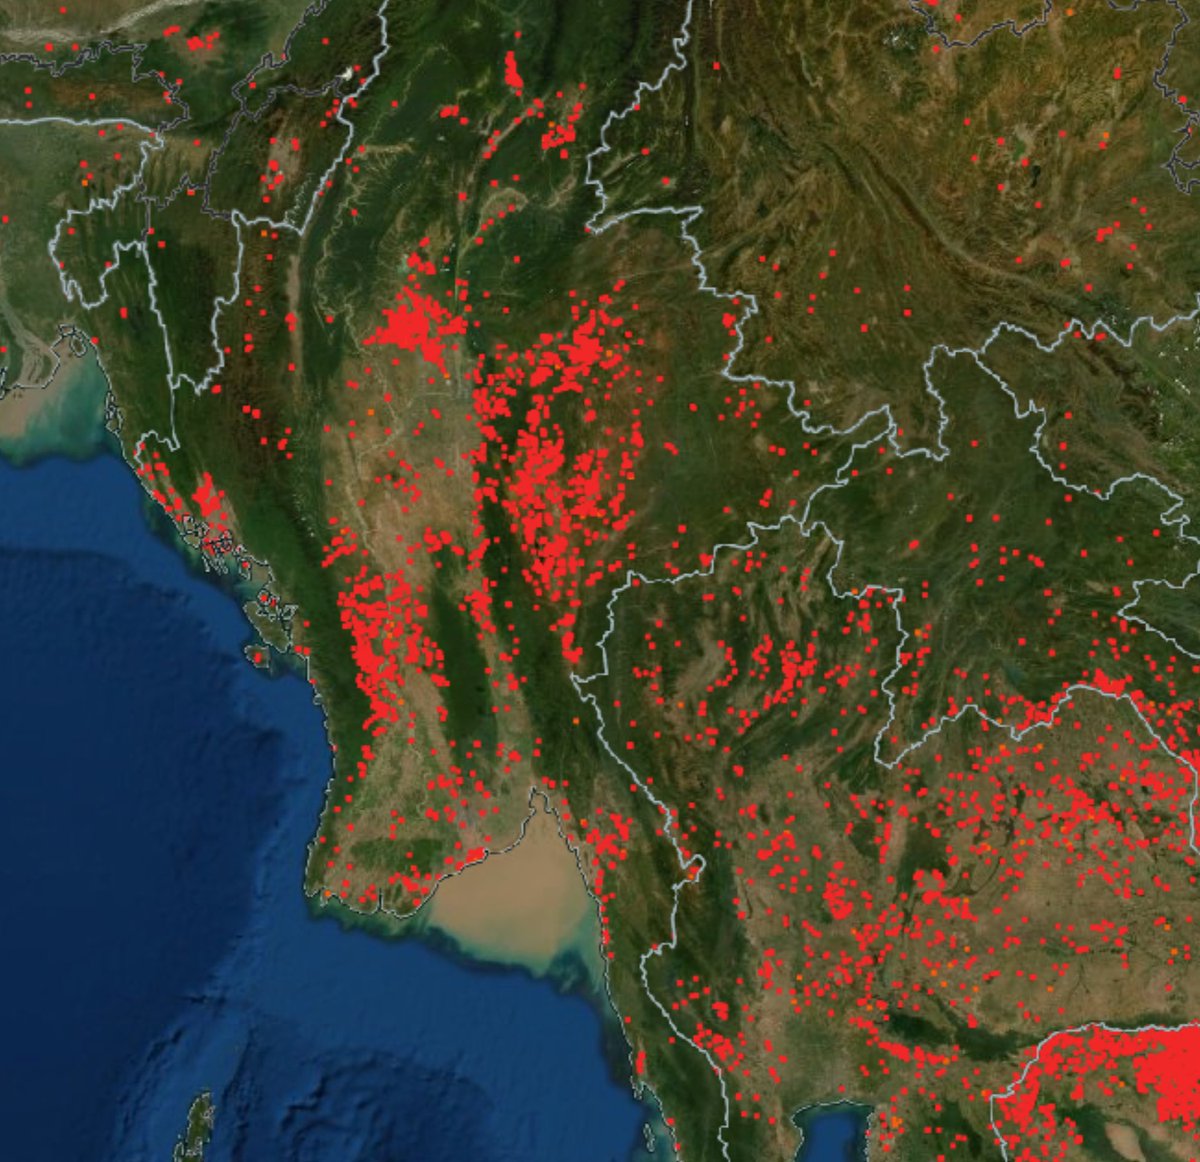
Following reports of a village being burnt, the first thing that we try to do is verify the attack. For that we look for thermal anomaly detections from several satellites that orbit the globe twice per day. These are the VIIRS and Aqua/Terra Earth Observation satellites.
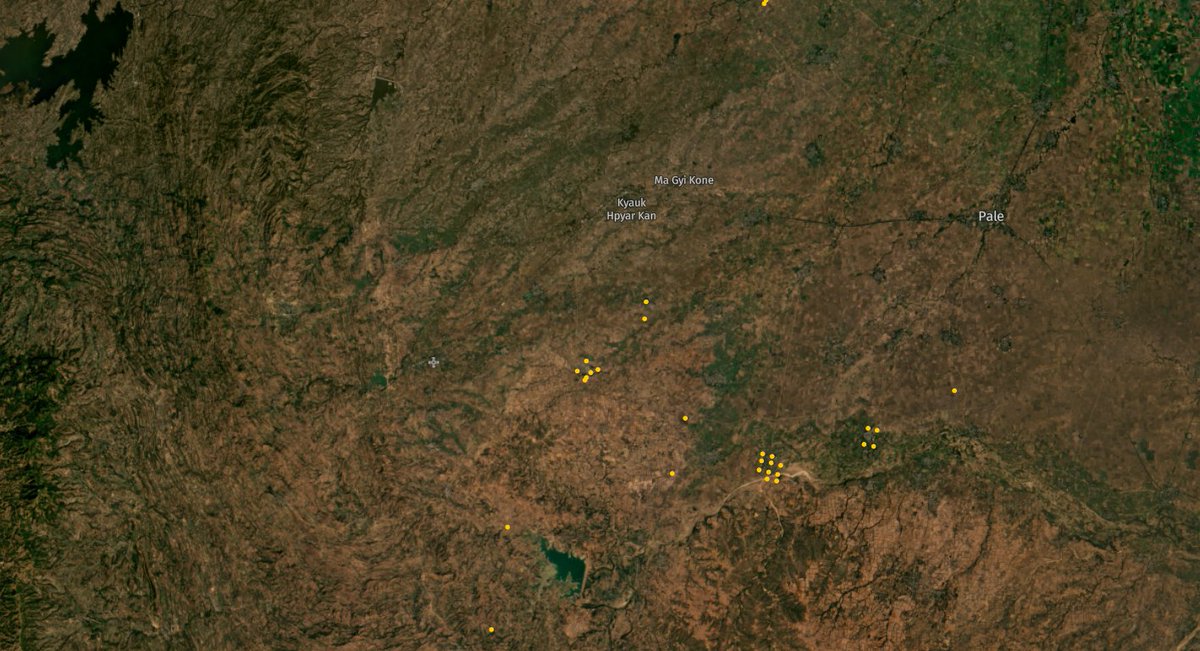
The data from these satellites regularly gets uploaded to a NASA website called FIRMS:
firms.modaps.eosdis.nasa.gov/map/#d:24hrs;@…
There are a lot of fires (mostly burning agricultural fields after harvest), but if you have specific info it is very useful to verify.
firms.modaps.eosdis.nasa.gov/map/#d:24hrs;@…
There are a lot of fires (mostly burning agricultural fields after harvest), but if you have specific info it is very useful to verify.
Some twitter accounts are dedicated to automatically detecting likely fires within likely settlements. Such as @FIRIS_FireAlert, which has recently branched out into monitoring Myanmar along with Africa.
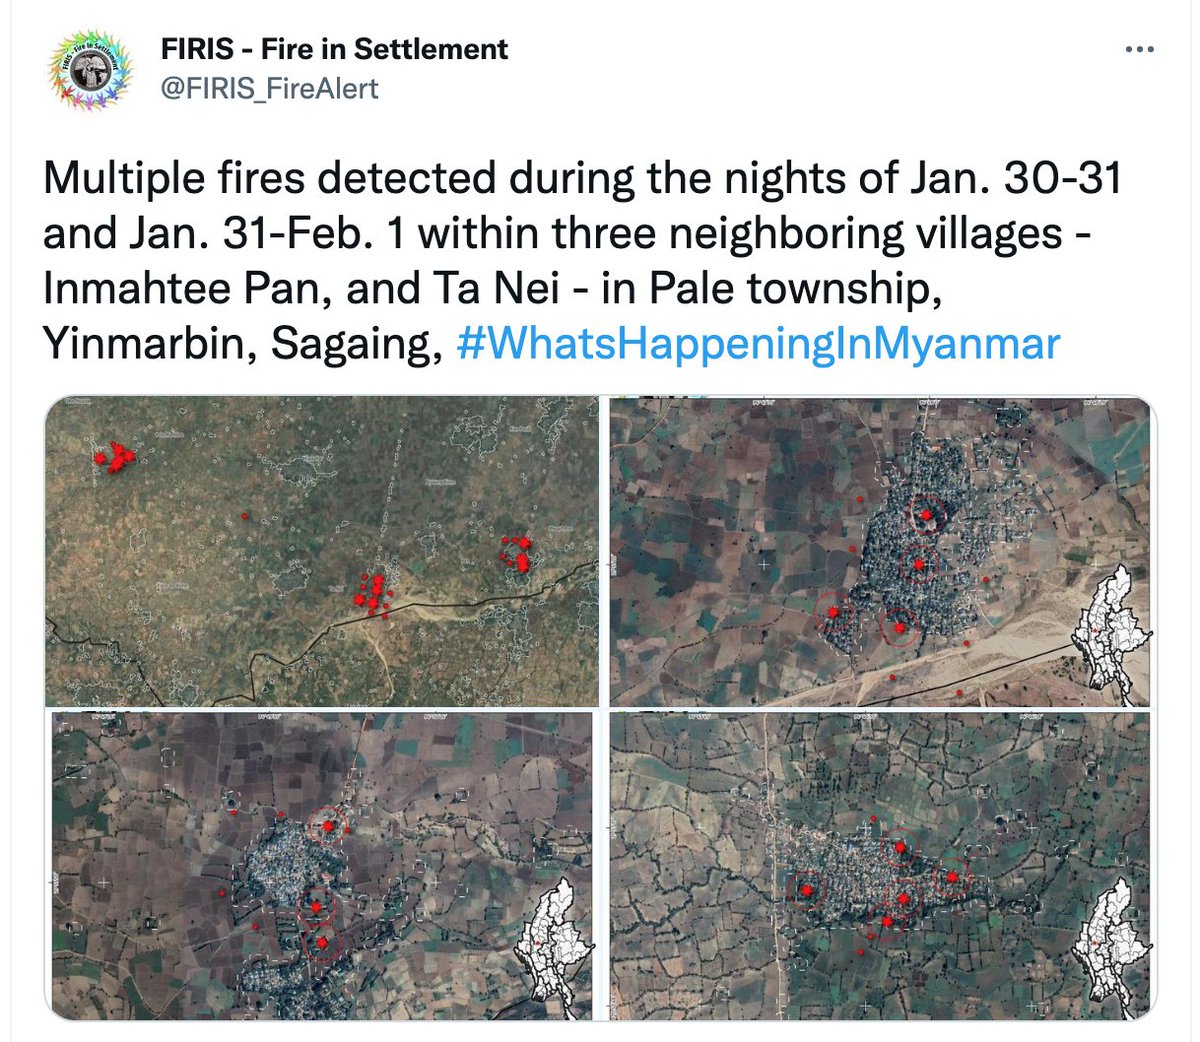
This method has limitations however. It relies on clear skies, and fire actively burning at around 11:30am or 11:30pm, local time, which is when the satellites pass over.
Otherwise, it won't show any detections. This means the absence of a detection =/= no fire.
Otherwise, it won't show any detections. This means the absence of a detection =/= no fire.

In these cases, we rely on classic geolocation to verify the fires: (1)Matching features to locate the place photographed and (2) verifying that it is new footage.
Often these photos are from far away, but still allow for verification of a fire having taken place.
Often these photos are from far away, but still allow for verification of a fire having taken place.

Next, we often try to map the extent of the damage, to quantify how many structures, or how much of the village, was destroyed.
Image shows a recent example (more here:
But there are several methods of varying precision that we can use.
Image shows a recent example (more here:
https://twitter.com/MyanmarWitness/status/1489960180007768069).
But there are several methods of varying precision that we can use.

Let's start with the most basic, classic geolocation of ground footage.
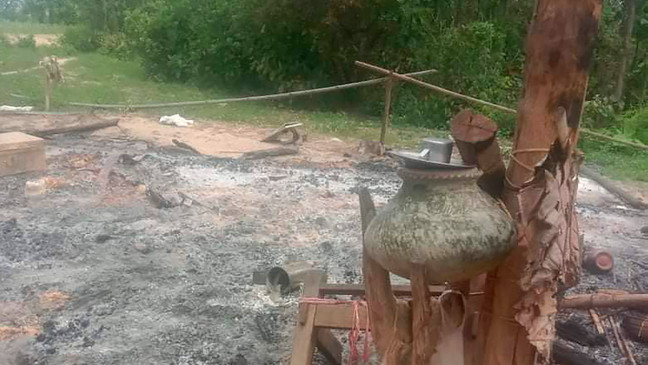
Media coming out of Myanmar is not always particularly useful, showing very close up photos of the damage that are impossible to accurately geolocate.
Here's an example.
Media coming out of Myanmar is not always particularly useful, showing very close up photos of the damage that are impossible to accurately geolocate.
Here's an example.
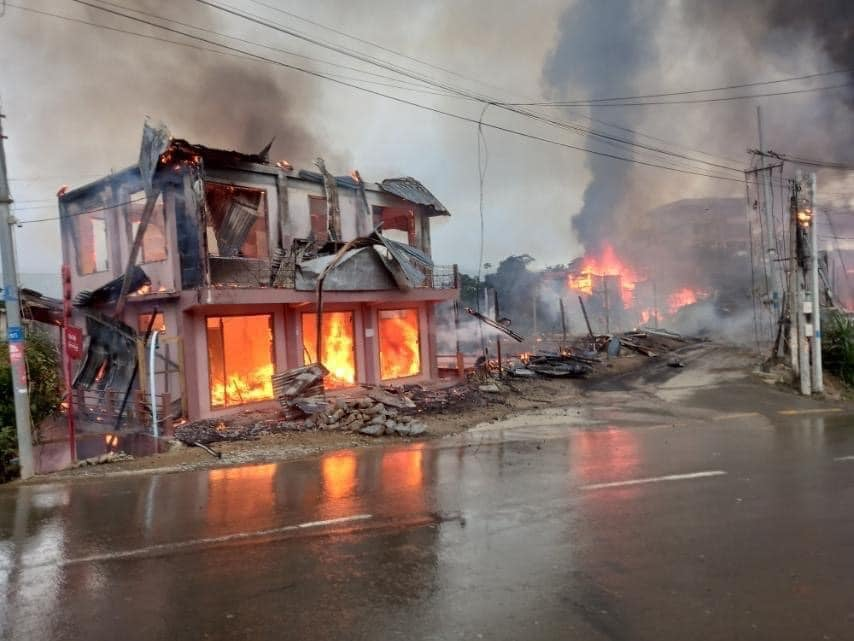
Other footage, is more useful.
This image was taken in Thantlang during the 18 September arson attack.
We geolocated it by matching the distinctive building with other footage we had of the area: google.com/maps/place/22%….
This lets us map at least 10 burnt structures.
This image was taken in Thantlang during the 18 September arson attack.
We geolocated it by matching the distinctive building with other footage we had of the area: google.com/maps/place/22%….
This lets us map at least 10 burnt structures.
But these photos, and even videos, are far from able to provide a complete picture of the area that has been burnt.
For this we go back to satellites.
But the ideal, high-resolution, high-quality satellite imagery is rarely what we get...
For this we go back to satellites.
But the ideal, high-resolution, high-quality satellite imagery is rarely what we get...

The higher resolution a satellite is, the smaller area it can image daily, and the longer you generally need to wait for the imagery. What we generally have is lower resolution - either open-source scientific imagery, or what a company called @PlanetLabs can provide.

Let's first look at the open source satellites. The best are the Sentinel-2 satellites, run by @ESA_EO. This pair of satellites images the entire globe at 10m resolution every five days. When most of a village has been burnt it can generally be detected here.

The general rule of thumb I go by is that something is clearly detectable by a satellite if its sides are more than 4x4 pixels, so for this satellite 40x40m.
However, for stuff like the burning of villages, the change is often more subtle, more textural than anything else.
However, for stuff like the burning of villages, the change is often more subtle, more textural than anything else.
Large parts of the village of Ke Bar were burnt in mid-Dec 2021. We can verify that a fire occurred using geolocation or FIRMS, but we can't clearly quantify the scale of the fire (other than that it was big).

We can look at an RGB-stretch of the Sentinel imagery from Dec 1st (pre-fire) and from Dec 16th (post-fire) and see that patches of the village near the centre look different, along with a small area closer to the North.

The RGB stretch here approximates what the human-eye would see, but shifting into other wave-lengths provides better insight. Here you can clearly see burn scars if we look at infrared false-colour imagery, with red showing healthy vegetation and black fire scars.

Here is a comparison of an approximated map of the fire scars comparing what is detectable from natural-colour imagery (green lines) and false-colour infrared imagery (red lines). We will come back to this village later, to compare it to a 'ground truth'.
#OSINT
#OSINT

Next, we should look at satellite imagery from @PlanetLabs. This company has a fleet of hundreds of satellites that capture imagery of most of the earth every day at 3m resolution, and with infrared imagery.

This allows for very rapid analysis of fire damage, here we will look at fires that took place in Pale township between Dec 30th and Feb 1st, then, one village was burnt every night. We were able to download imagery from Dec 30th and Feb 2nd.
From here we follow the same idea looking at infrared imagery, but we have one more trick up our sleeve, which is helped by the fact that imagery from Planet is only days apart, rather than weeks apart like the Sentinel imagery we were relying on. Direct vegetation health.
The NDVI index directly examines the health of vegetation and helps cut out various 'noise' from the signal. Here bright colours represent healthier vegetation. And you can VERY clearly see the fire-scars.

In fact, if we directly compare the two, the areas affected by fire literally jump out. It's then possible to basically to trace these bright spots to map in pretty solid detail, as can be seen here.

Here is a video showing that entire process.
Then it's time to look at the gold-standard of remotely sensed fire analysis, Very High Resolution (VHR) imagery. @PlanetLabs and @Maxar, along with other companies such as @Airbus, have VHR imagery which makes it possible to pick out individual structures.

This sort of imagery is what makes up the vast majority of Google Maps, and the standard that most people expect when it comes to satellite imagery. However, this high resolution means a small footprint on the world, and a longer interval between images.
There is also no set schedule for when places get imaged, so unless you're willing to fork out thousands of dollars for an image, you're at the whim of richer customers - generally governments - who often aren't interested in Myanmar - or the companies themselves.
But when it is available, it is by far the best. This is looking back at Ke Bar village, where Google Earth has bought post-fire imagery of the town.
Here we can map the exact areas of fire and see - at the scale of individual structures - exactly what was burnt.
Here we can map the exact areas of fire and see - at the scale of individual structures - exactly what was burnt.

In this map we can see the fire scars mapped by Sentinel Visible [Green] and Infrared [Red] imagery, along with the VHR scar [White] which is far higher detailed. Burnt structures are white dots.

If we overlay them all together, we can see that they all accurately capture the areas that have been burnt.
There is increasing detail, and it's not until the VHR imagery that we can accurately estimate the number of structures burnt.
Here we mapped 99 burnt structures.
There is increasing detail, and it's not until the VHR imagery that we can accurately estimate the number of structures burnt.
Here we mapped 99 burnt structures.

Finally, the last method to talk about is drone imagery.
This is the highest resolution, the quickest response and the only method that is effective regardless of cloud-cover.
Unfortunately it does rely on actors on the ground filming.
This is the highest resolution, the quickest response and the only method that is effective regardless of cloud-cover.
Unfortunately it does rely on actors on the ground filming.
We hope that drone footage recordings will become standard in the future as the importance of documenting incidents is fully understood by those affected.
For now, drone footage - especially filmed towards the start of the fire like this example - is still quite rare.
For now, drone footage - especially filmed towards the start of the fire like this example - is still quite rare.
Method-wise, it is just a better version of the VHR imagery.
You overlay it on pre-fire satellite imagery and are able to map the fire scar in detail along with the burnt structures in detail.
You overlay it on pre-fire satellite imagery and are able to map the fire scar in detail along with the burnt structures in detail.
Here we return to our earlier example from Bin village in Mingin township.
The fire happened on the night of Monday 31 Jan 2022.
Chindwin Chit Thu was able to film the damage with a drone the following Friday.
And from that we were able to map around 185 burnt structures.
The fire happened on the night of Monday 31 Jan 2022.
Chindwin Chit Thu was able to film the damage with a drone the following Friday.
And from that we were able to map around 185 burnt structures.

These are some of the methods, mostly open source, that we use to map fire damage across Myanmar, these methods apply globally, but the repeated and widespread arson attacks in Myanmar make it particularly pertinent there.
*Documenting fires in Myanmar*
GUEST THREAD
@MyanmarWitness X @Nrg8000
🔍Continue exploring
Map of fire incidents in Myanmar
myanmarwitness.org/fire-map
Geolocation videos on Thantlang Fires
myanmarwitness.org/thantlang-fires
Contact
👉 info@myanmarwitness.com
#MyanmarWitness
GUEST THREAD
@MyanmarWitness X @Nrg8000
🔍Continue exploring
Map of fire incidents in Myanmar
myanmarwitness.org/fire-map
Geolocation videos on Thantlang Fires
myanmarwitness.org/thantlang-fires
Contact
👉 info@myanmarwitness.com
#MyanmarWitness

• • •
Missing some Tweet in this thread? You can try to
force a refresh


