Understanding STAGE ANALYSIS
I read one of the greatest Trading Books so that You dont have to !🧵
Secrets of Profiting in Bull and Bear Markets
by Stan Weinstien
Retweet and Share !
Comment Yes for another Book Summary :)
I read one of the greatest Trading Books so that You dont have to !🧵
Secrets of Profiting in Bull and Bear Markets
by Stan Weinstien
Retweet and Share !
Comment Yes for another Book Summary :)

Stan Weinstein's Stage Analysis offers traders a powerful methodology to identify trends in the markets while following strict risk management principles.
Stage Analysis is used to identify the longer-term trend of a stock or index. There are 4 different stages
1/n
Stage Analysis is used to identify the longer-term trend of a stock or index. There are 4 different stages
1/n

✅The Basing Area,
✅Advancing Phase
✅The Top Area
✅Declining Phase
2/n
@kuttrapali26 @AdityaTodmal @aditya_kondawar @Rishikesh_ADX @ProdigalTrader
✅Advancing Phase
✅The Top Area
✅Declining Phase
2/n
@kuttrapali26 @AdityaTodmal @aditya_kondawar @Rishikesh_ADX @ProdigalTrader
Stage 1
After stock XYZ has been declining for several months, it eventually will lose downside momentum and start to trend sideways.
Volume will usually lessen-dry up-as a base forms.
Here Buyers = Sellers with Equal Fight
3/n
Example : CDSL


After stock XYZ has been declining for several months, it eventually will lose downside momentum and start to trend sideways.
Volume will usually lessen-dry up-as a base forms.
Here Buyers = Sellers with Equal Fight
3/n
Example : CDSL


Initially the 30-week MA loses its downside slope and starts to flatten out.
This basing action can go on for months
or, in some cases, years.
Volumes Increase on Right side of base :
Also forms During the first primary base a stock forms after it’s IPO : IEX , BASML
4/n

This basing action can go on for months
or, in some cases, years.
Volumes Increase on Right side of base :
Also forms During the first primary base a stock forms after it’s IPO : IEX , BASML
4/n


Stage 2 : Advancing Phase , Investing
This is the stage where we should be looking to take long positions in a stock or index. Buyers are now in control and stock has demand
Such a breakout above the top of the resistance zone and the 30-week MA should have huge Volumes
5/n

This is the stage where we should be looking to take long positions in a stock or index. Buyers are now in control and stock has demand
Such a breakout above the top of the resistance zone and the 30-week MA should have huge Volumes
5/n


There Should be one pullback to previous breakout region and that is low risk entry point
The MAs Start Trending up and a Structure of HH and HL is formed with pullbacks having lower volumes
Here Investors should buy on first Base Breakout to Ride the trend
6/n


The MAs Start Trending up and a Structure of HH and HL is formed with pullbacks having lower volumes
Here Investors should buy on first Base Breakout to Ride the trend
6/n


Trader Entry Rules in STAGE 2
The Ideal Buy Point for Traders Traders should look for bases within an existing Stage 2 uptrend and focus on breakouts on volume. Intermediate term traders can also use investor buy points
7/n


The Ideal Buy Point for Traders Traders should look for bases within an existing Stage 2 uptrend and focus on breakouts on volume. Intermediate term traders can also use investor buy points
7/n


Stage 3 : Topping PhaseStage 3:
The Top Area This stage occurs during longer-term bases in a stock’s lifecycle after a Stage 2 Uptrend. Stock Move near 30 wema and forms a new base .
No clear Trend is Established
Buyers = Sellers
8/n

The Top Area This stage occurs during longer-term bases in a stock’s lifecycle after a Stage 2 Uptrend. Stock Move near 30 wema and forms a new base .
No clear Trend is Established
Buyers = Sellers
8/n


Traits in Stage 3 30 week MA starts flattening out w/ price chopping above & below this line Balance has returned between Buyers = Sellers, leading to sideways
10/n


10/n


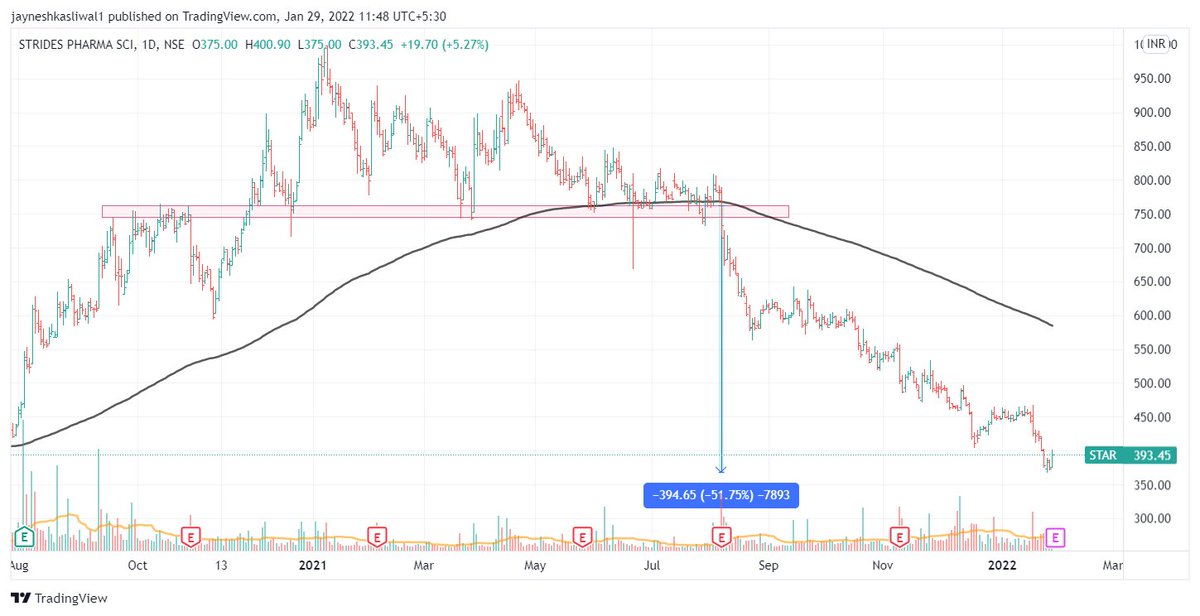
Stage 4: The Declining Phase
Sellers >> Buyers
Price will begin to trend below a declining 30 week moving average. The big money is lost going/staying long in a Stage 4 decline.
Volume May or Maynot Increase Initially during decline
11/n

Sellers >> Buyers
Price will begin to trend below a declining 30 week moving average. The big money is lost going/staying long in a Stage 4 decline.
Volume May or Maynot Increase Initially during decline
11/n


Traits in Stage 4 Price breaks below the bottom of the support zone Don't need overwhelming volume to the downside to enter a Stage 4 No matter how the fundamentals appear, the price trend is all that matters
12/n

12/n


Important Points :
Major The active trader/investor must take note of the slope of the 30 week moving average. Every time the 30 week moving average flattens itself out, the stock is set to make a trend decision. Be ready to act if it enters either a Stage 2 or Stage 4
13/n END
Major The active trader/investor must take note of the slope of the 30 week moving average. Every time the 30 week moving average flattens itself out, the stock is set to make a trend decision. Be ready to act if it enters either a Stage 2 or Stage 4
13/n END

If you liked the summary do Follow me @JayneshKasliwal
You can Check my 6 Mentorship Videos :
app.cosmofeed.com/view_group/61f…
You can Check my 6 Mentorship Videos :
app.cosmofeed.com/view_group/61f…
• • •
Missing some Tweet in this thread? You can try to
force a refresh


