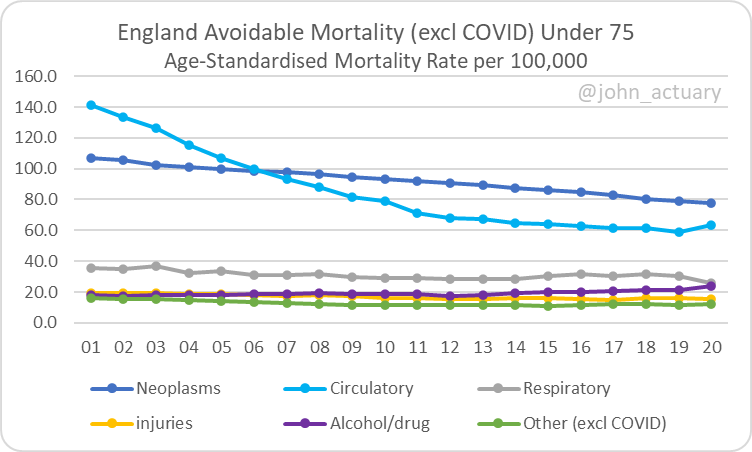
2020 data from ONS for Under 75s shows a significant increase in "avoidable mortality", though COVID has been classified as avoidable, so there's no particular surprise there.
What about if we exclude COVID though?
1/
Now we see a different picture with 2020 the second lowest yet, and just 0.4% higher than 2019.
So in aggregate there's no evidence of material non-COVID deaths increasing due to the pandemic.
Let's look at individual causes next...
2/
Splitting out causes we do see statistically significant increases in circulatory (+8%) and alcohol/drug related deaths (+12%), but these are offset by falls elsewhere.
3/
That covers the first 10 months of the pandemic - obviously 2021 may show a different picture, particularly as delayed diagnoses etc start to have a bigger impact, but these data don't support the material extent of "lockdown" impact some have suggested happened in 2020.
4/
Report here. Note that the international definition of avoidable mortality is used.
A few salient points from the latest SAGE minutes published this afternoon:-
Current behaviour is estimated to be suppressing transmission by between 20% & 45%. (That would suggest a complete return to pre-pandemic behaviour would increase transmission by between 25% & 80%.) 1/
It notes the benefit to transmission of "self regulation" of behaviour and the risks if reduced testing is available (and later comments on impact of charging for tests, particularly for those who are or living with CV people).
2/
It notes that the next variant might not be as mild as Omicron appears to be, and could emerge very quickly. The benefit of the ONS infection survey in monitoring for such an event is noted.
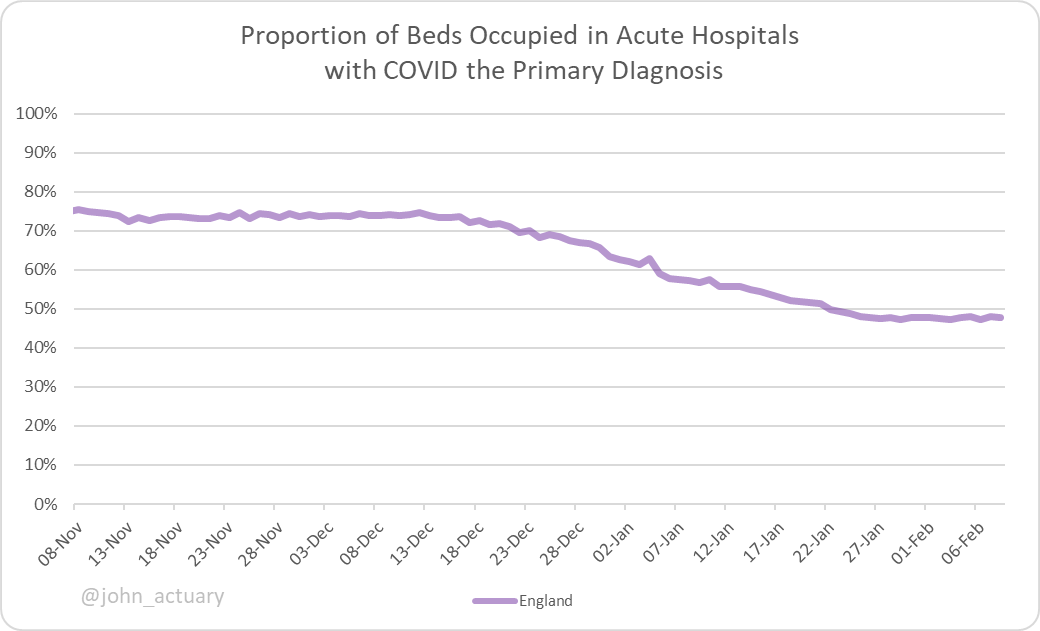
Latest data on England beds occupied with COVID show that the proportion where COVID is regarded as the primary diagnosis has stabilised over the last couple of weeks at just under 50%.
Remember that doesn't mean none of the others weren't in some way triggered by COVID. 1/
There's quite a divergence by region though, with London the lowest at around a third, up to the SW (where admissions have been stubbornly level of late) the highest at just under two thirds.
2/
Overall, the number in acute hospitals where COVID is the primary diagnosis has fallen this week by 11%, and now stands at 5,110. That's 40% down on the peak of 8,582, reached exactly a month ago today.
The latest advance infection survey data from the ONS shows increases in 3 of the 4 countries.
E🔼from 4.8% to 5.2%
W🔽from 4.6% to 4.0%
NI🔼from 7.4% to 7.9%
S🔼from 3.5% to 4.0%
Overall 3.3m are estimated to have been positive in the week ending 5th Feb.
There's still a relatively tight spread of variation by region. However it's noticeable that the 3 regions (SE,SW,E) that recently saw modest growth in admissions (in contrast to the others) are outliers with a significant % growth (around 40%) over the last two weeks.
2/
By age the youngest group appears now to have peaked but is still exceptionally high, and there is still steady growth in the Yr 7 to 11 band too.
Above age 50, levels are much lower but have increased this week, eg 70+ from 2.0% to 2.5%.
Jamie's wording here is aimed at making you think that the pandemic has triggered a huge increase in psychiatric/suicide related call-outs in Wales.
The graph below is correct, but let's take a closer look...
1/
Actually you don't need to take that close a look to see that there's something odd with the data. Only 1 case in 2017, rising to 28 in 2019 - all before the pandemic.
So it looks like there are data quality issues here. A change in reporting method maybe?
2/
Let's look at a monthly analysis next - I've helpfully split out the period before any restrictions started, and you can see that the big increase was all prior to the pandemic taking hold.
It looks like a reporting change happened in late 19 - so nothing to do with COVID.
The BBC becomes the latest organisation to debunk the false claims that only 17,000 died of the virus, widely shared by @DavidDavisMP. He's specifically mentioned in this piece as sharing the offending video.
No less than the Office for Statistics Regulation has weighed in too - it really is remarkable how many trusted bodies are having to refute the misinformation that @DavidDavisMP has shared.
Fortunately there's no evidence yet that BA.2 has a greater propensity for vaccine escape. Indeed, there's a possibility it's slightly less able in that regard, though not statistically robust yet.
2/
You can see BA.2 start to nibble away at BA.1's dominant position here in the bottom right hand corner. Note because of sequencing time, this cuts off around 10 days ago.