John Roberts Profile picture
Mar 10 9 tweets 4 min read
The latest results from the #REACT study by @imperialcollege and @IpsosMORI are out, and whilst overall prevalence is lower, there's evidence that in the 55 and over age groups it is on an upward trend, consistent with a recent increase in admissions.

A summary 🧵
1/
Overall prevalence is down from Round 17 (4.4%) to 2.9%, and within the Round (8th Feb to 1st Mar) R is estimated at 0.94, although as noted above for 55+ it is put at 1.04.

Although falling, it's still the 2nd highest ever level recorded by REACT by some margin.

2/
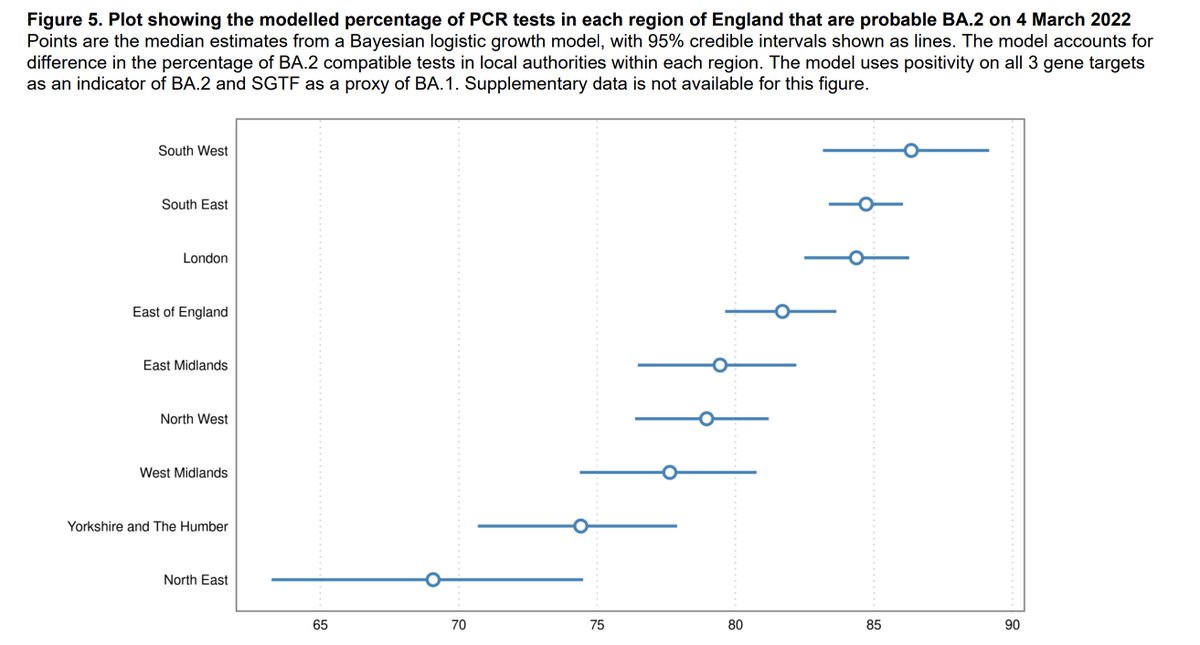
Regionally, most regions clearly fell from Round 17, but in contrast the South West and South East showed small, although not statistically significant increases, and along with London were the highest.

3/
At lower tier LA level, 6 were in London, and the other four were clustered in what some in my locality will still (usually without much affection) remember as the old Avon area (Bristol, South Glos, BANES and North Somerset).

4/
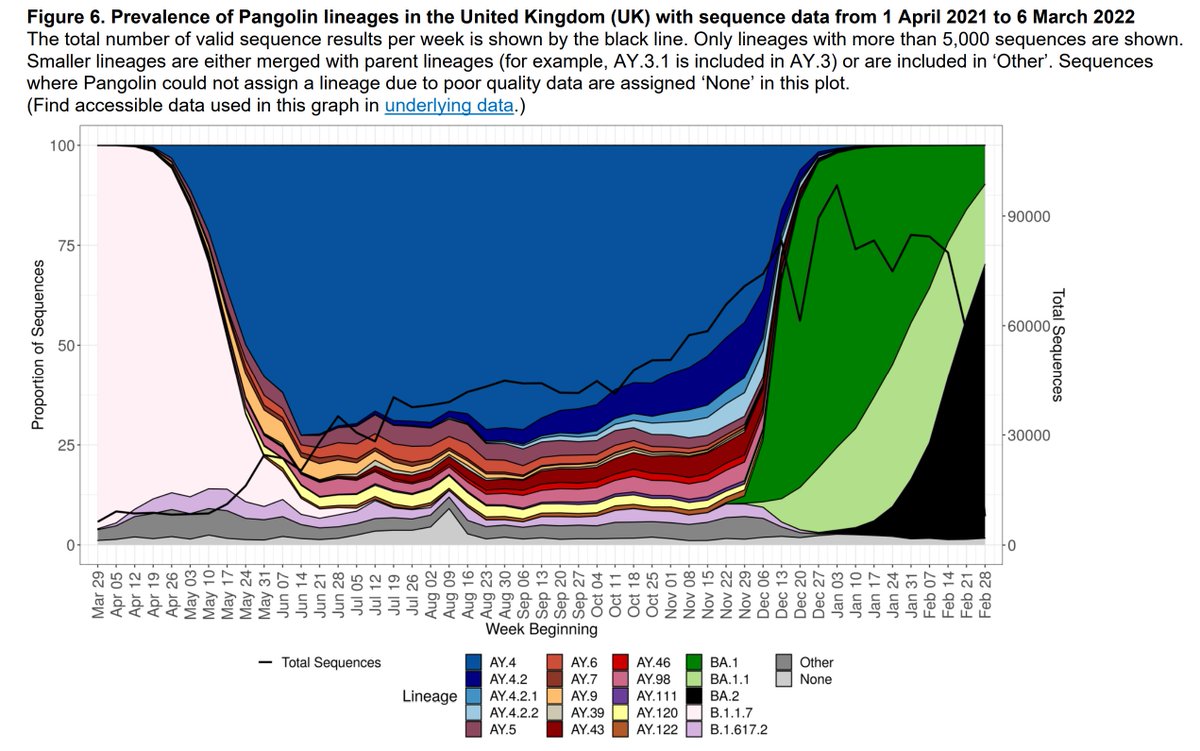
The proportions of BA.2 were highest in the SW and London too, and indeed the pattern here is very similar to the overall prevalence levels too, reflecting the growth advantage that BA.2 has, estimated at an additive rate of 0.4 to Rt.

5/
Indeed, by the end of the round the proportion of BA.2 cases was approaching 50% of the total. And remember Delta? Over the whole round only 1 of the 1,195 cases sequenced was found to be that variant.

6/
By age you can see here how the greatest falls from Round 17 are in the younger age bands. At older ages the falls are much lower and as noted earlier, within the Round there was evidence that over 55 prevalence was in fact increasing again.

7/
A summary here of all the 18 rounds that this fantastic study has produced over the last two years. It's been a great source of data to complement other estimates of prevalence within England, and I'd like to thank all those involved over that period.

8/8
And here's the link to the report, with much more analysis than I've covered in my summary thread.

9/8
spiral.imperial.ac.uk/bitstream/1004…

• • •

Missing some Tweet in this thread? You can try to force a refresh
 

Keep Current with John Roberts

John Roberts Profile picture

Stay in touch and get notified when new unrolls are available from this author!

Read all threads

This Thread may be Removed Anytime!

PDF

Twitter may remove this content at anytime! Save it as PDF for later use!

Try unrolling a thread yourself!

how to unroll video
  1. Follow @ThreadReaderApp to mention us!

  2. From a Twitter thread mention us with a keyword "unroll"
@threadreaderapp unroll

Practice here first or read more on our help page!

More from @john_actuary

Mar 11
The latest Variant Technical Bulletin shows how BA.2 is now dominant across all of England, with the South West highest - we've also see that admissions growth has been fastest there too.
(Note the x-axis scale though, the range is smaller than it immediately appears.)

1/ Image
And here's why - with data showing that the secondary attack rate in both household and non-household settings is higher for BA.2 than for its older sibling BA.1.

2/ Image
And the result of that is shown here, where we can see how BA.1, which burst on to the scene in early Dec has rapidly been usurped first by BA.1.1, and more recently by BA.2.

3/ Image
Read 5 tweets
Mar 11
Latest #infectionsurvey data from ONS shows prevalence rising in all four countries, with E&W turning upwards, a continued rise in S and NI reverting quickly to its previous very high levels.

1/ Image
The growth in prevalence at older ages is of particular concern. For 70+ levels are up over 50% in just two weeks.

2/ Image
Here's the full picture by age bands, showing a levelling off of previous falls at the youngest age group, and increases in all adult ages.

3/ Image
Read 6 tweets
Mar 10
Admissions growth in England continues, today's figure of 1,384 being 25% being a quarter higher than last Thu, nudging the weekly growth up to 22%.

Beds occupied growth is steadily increasing too, but ventilator bed occupancy is more stable.
1/ Image
We can see here how admissions decline (represented by being below 0% on the y-axis) has rapidly transitioned to growth.

I've also shown the SW, as that has outpaced the national average, and in recent days has been around a third up over the week.

2/ Image
Some of this growth will be due to hospital acquired infections, and these do appear to be increasing faster than overall admissions, as @AdeleGroyer reports here.

3/
Read 5 tweets
Mar 10
Thursday brings the weekly update on COVID beds occupied in acute hospitals where COVID is assessed as the primary diagnosis for which they are being treated.

After levelling off last week, the number has started to increase again (+4%), consistent with the overall position.
1/
The prop'n of acute hospital COVID beds where it is the primary diagnosis continues to drift slowly downwards, down to 43% this week. During a period of prevalence growth we might expect "incidental" cases to rise earlier than "primary" cases, accelerating the reduction.
2/
There's a wide variation by region, with the highest, the North West at 55% more than double that in London, where it is now just 27%.

Note that the overall bed figures published daily include non-acute hospitals, so these %'s are likely to be lower for the overall picture.

3/
Read 4 tweets
Mar 9
A little bit of insight here from @ActuaryByDay as to what the CMI does as its "day job". Future projections of mortality trends are hugely important in assessing the liabilities (and thus the financial health) of insurers and pension schemes.

1/
If your liabilities increase if people live longer (eg pension schemes) then it's critical to make assumptions as to how much mortality will improve in future years - not easy in normal times, let alone now, as these need to be projected up to 40 years ahead.

2/
The model referred to provides a basis on which actuaries working in this field can use, but has a lot of flexibility to ensure that actuaries can tailor it based on their own judgement with regard to the use, eg based on the demographic profile of the pension scheme members.
3/
Read 4 tweets
Mar 7
2020 data from ONS for Under 75s shows a significant increase in "avoidable mortality", though COVID has been classified as avoidable, so there's no particular surprise there.

What about if we exclude COVID though?

1/
Now we see a different picture with 2020 the second lowest yet, and just 0.4% higher than 2019.

So in aggregate there's no evidence of material non-COVID deaths increasing due to the pandemic.

Let's look at individual causes next...

2/
Splitting out causes we do see statistically significant increases in circulatory (+8%) and alcohol/drug related deaths (+12%), but these are offset by falls elsewhere.

3/
Read 5 tweets

Did Thread Reader help you today?

Support us! We are indie developers!


This site is made by just two indie developers on a laptop doing marketing, support and development! Read more about the story.

Become a Premium Member ($3/month or $30/year) and get exclusive features!

Become Premium

Don't want to be a Premium member but still want to support us?

Make a small donation by buying us coffee ($5) or help with server cost ($10)

Donate via Paypal

Or Donate anonymously using crypto!

Ethereum

0xfe58350B80634f60Fa6Dc149a72b4DFbc17D341E copy

Bitcoin

3ATGMxNzCUFzxpMCHL5sWSt4DVtS8UqXpi copy

Thank you for your support!

Follow Us on Twitter!

:(