s this formula difficult? πŸ€”

This is the formula for Gradient Descent with Momentum as presented in Wikipedia.

It may look intimidating at first, but I promise you that by the end of this thread it will be easy to understand!

Thread πŸ‘‡

#RepostFriday
The Basis ◻️

Let's break it down! The basis is this simple formula describing an iterative optimization method.

We have some weights (parameters) and we iteratively update them in some way to reach a goal

Iterative methods are used when we cannot compute the solution directly
Gradient Decent Update πŸ“‰

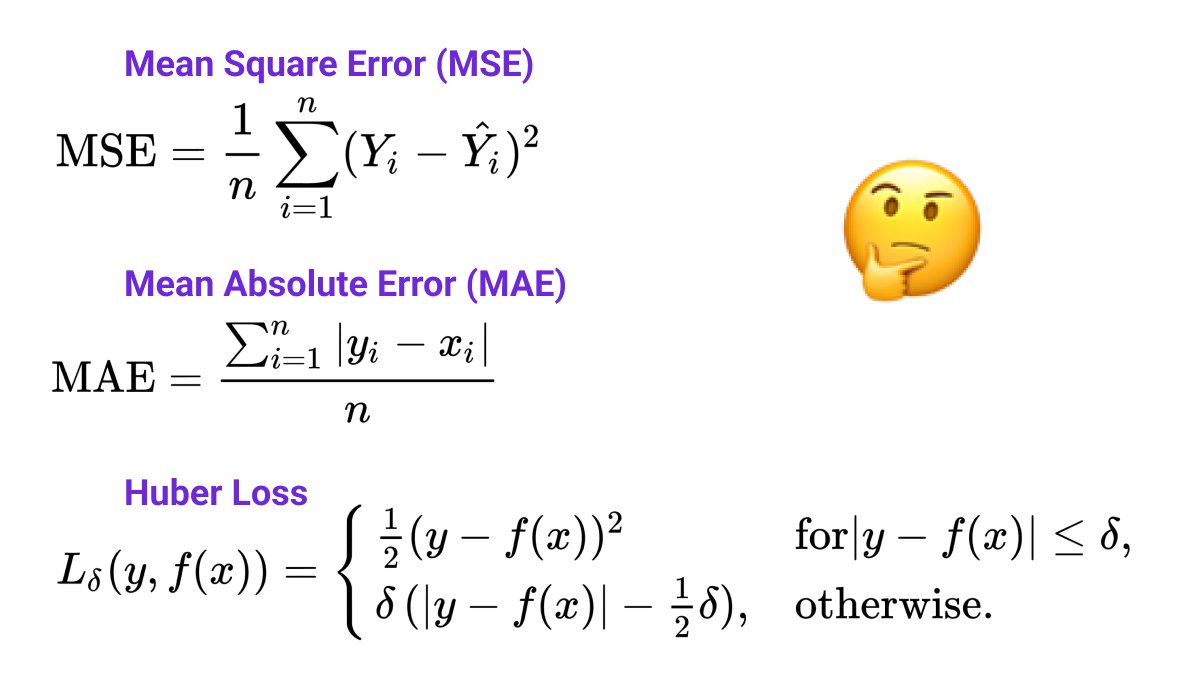
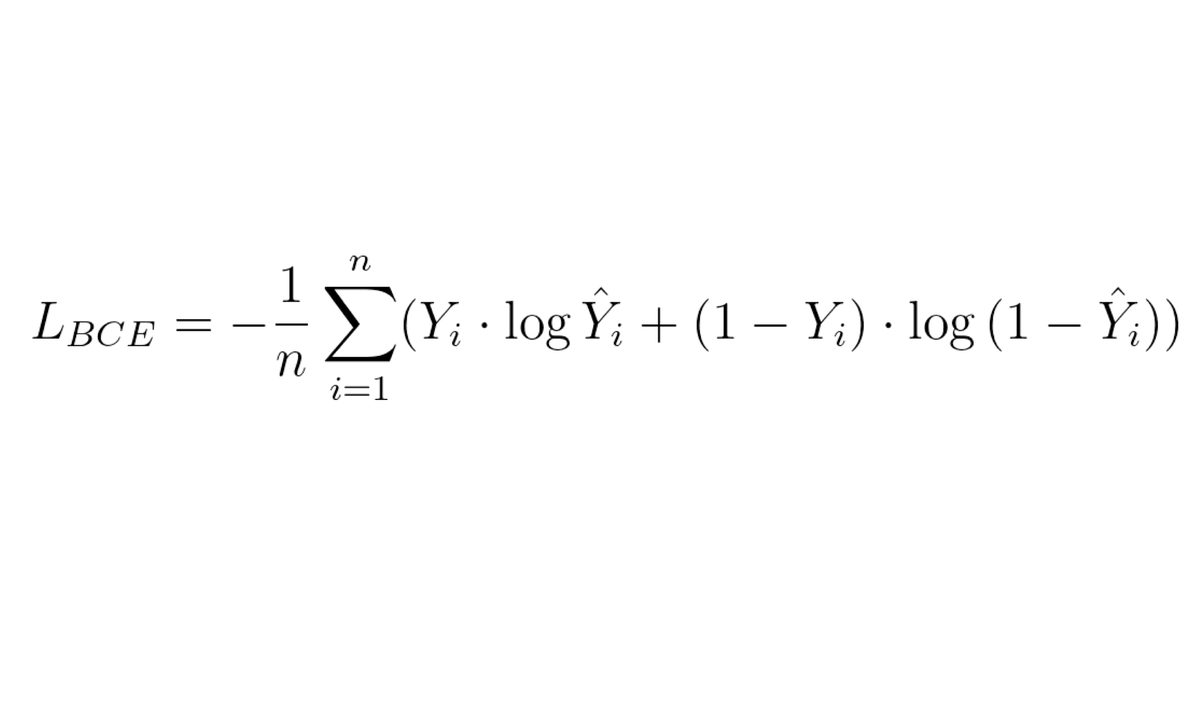
We define a loss function describing how good our model is. We want to find the weights that minimize the loss (make the model better).

We compute the gradient of the loss and update the weights by a small amount (learning rate) against the gradient.
Here is an illustration of how it works.

The gradient tells us if the loss will decrease (negative gradient) or increase (positive gradient) if we increase the weight.

The learning rate defines how far along the gradient we will jump in the current step of the optimization.
Momentum ⚽️

Now we add the momentum. It is defined as the weight update in the previous step times a decay factor.

The decay factor is just a number between 0 and 1 defining how much of the previous update will be taken into account. Ξ± = 0 means no momentum and Ξ± = 1 is a lot.
A useful analogy is a ball rolling down a hill. If the hill is steep, the ball will accelerate (we update the weights more)

This will help the ball jump over small local minima and continue down the hill (to a smaller loss).

More momentum means a heavier ball with high inertia
Putting it all together 🏁

So, in the original formula we update the weights using two terms.

The *gradient descent* term pushes us down the slope of the loss function.

The *momentum* term helps us accelerate and jump over small local minima.

Not that hard, right?
Every Friday I repost one of my old threads so more people get the chance to see them. During the rest of the week, I post new content on machine learning and web3.

If you are interested in seeing more, follow me @haltakov

β€’ β€’ β€’

Missing some Tweet in this thread? You can try to force a refresh
γ€€

Keep Current with haltakov.eth 🌍 πŸ‡ΊπŸ‡¦

haltakov.eth 🌍 πŸ‡ΊπŸ‡¦ Profile picture

Stay in touch and get notified when new unrolls are available from this author!

Read all threads

This Thread may be Removed Anytime!

PDF

Twitter may remove this content at anytime! Save it as PDF for later use!

Try unrolling a thread yourself!

how to unroll video
  1. Follow @ThreadReaderApp to mention us!

  2. From a Twitter thread mention us with a keyword "unroll"
@threadreaderapp unroll

Practice here first or read more on our help page!

More from @haltakov

Mar 16
Machine Learning Formulas Explained πŸ‘¨β€πŸ«

For regression problems you can use one of several loss functions:
β–ͺ️ MSE
β–ͺ️ MAE
β–ͺ️ Huber loss

But which one is best? When should you prefer one instead of the other?

Thread 🧡 Image
Let's first quickly recap what each of the loss functions does. After that, we can compare them and see the differences based on some examples.

πŸ‘‡
Mean Square Error (MSE)

For every sample, MSE takes the difference between the ground truth and the model's prediction and computes its square. Then, the average over all samples is computed.

For details, check out this thread:


πŸ‘‡
Read 20 tweets
Mar 11
Machine Learning in the Real World 🧠 πŸ€–

ML for real-world applications is much more than designing fancy networks and fine-tuning parameters.

In fact, you will spend most of your time curating a good dataset.

Let's go through the process together πŸ‘‡

#RepostFriday Image
Collect Data πŸ’½

We need to represent the real world as accurately as possible. If some situations are underrepresented we are introducing Sampling Bias.

Sampling Bias is nasty because we'll have high test accuracy, but our model will perform badly when deployed.

πŸ‘‡
Traffic Lights 🚦

Let's build a model to recognize traffic lights for a self-driving car. We need to collect data for different:

β–ͺ️ Lighting conditions
β–ͺ️ Weather conditions
β–ͺ️ Distances and viewpoints
β–ͺ️ Strange variants

And if we sample only 🚦 we won't detect πŸš₯ πŸ€·β€β™‚οΈ

πŸ‘‡ Image
Read 16 tweets
Mar 8
Machine Learning Formulas Explained πŸ‘¨β€πŸ«

This is the Huber loss - another complicated-looking formula...

Yet again, if you break it down and understand the individual, it becomes really easy.

Let me show you πŸ‘‡ Image
Background

The Huber loss is a loss function that is similar to the Mean Squared Error (MSE) but it is designed to be more robust to outliers.

MSE suffers from the problem that if there is a small number of severe outliers they can dominate the whole loss

How does it work? πŸ‘‡
The key to understanding math formulas is not to try to understand everything at the same time.

Try looking at the terms inside the formula. Try to understand them from the inside to the outside...

Here, we can quickly see that one term is repeated several times...

πŸ‘‡ Image
Read 13 tweets
Mar 4
Machine Learning Formulas Explained! πŸ‘¨β€πŸ«

This is the formula for the Binary Cross Entropy Loss. It is commonly used for binary classification problems.

It may look super confusing, but I promise you that it is actually quite simple!

Let's go step by step πŸ‘‡

#RepostFriday
The Cross-Entropy Loss function is one of the most used losses for classification problems. It tells us how well a machine learning model classifies a dataset compared to the ground truth labels.

The Binary Cross-Entropy Loss is a special case when we have only 2 classes.

πŸ‘‡
The most important part to understand is this one - this is the core of the whole formula!

Here, Y denotes the ground-truth label, while ΕΆ is the predicted probability of the classifier.

Let's look at a simple example before we talk about the logarithm... πŸ‘‡
Read 13 tweets
Mar 3
When machine learning met crypto art... they fell in love ❀️

The Decentralized Autonomous Artist (DAA) is a concept that is uniquely enabled by these technologies.

Meet my favorite DAA - Botto.

Let me tell you how it works πŸ‘‡
Botto uses a popular technique to create images - VQGAN+CLIP

In simple terms, it uses a neural network model generating images (VQCAN) guided by the powerful CLIP model which can relate images to text.

This method can create stunning visuals from a simple text prompt!

πŸ‘‡
Creating amazing images, though, requires finding the right text prompt

Botto is programmed by its creator - artist Mario Klingemann (@quasimondo), but it creates all art itself. There is no human intervention in the creation of the images!

Botto is trained by the community πŸ‘‡
Read 11 tweets
Feb 25
There are two problems with ROC curves

❌ They don't work for imbalanced datasets
❌ They don't work for object detection problems

So what do we do to evaluate our machine learning models properly in these cases?

We use a Precision-Recall curve.

Thread πŸ‘‡

#RepostFriday
Last week I wrote another detailed thread on ROC curves. I recommend that you read it first if you don't know what they are.


Then go on πŸ‘‡
❌ Problem 1 - Imbalanced Data

ROC curves measure the True Positive Rate (also known as Accuracy). So, if you have an imbalanced dataset, the ROC curve will not tell you if your classifier completely ignores the underrepresented class.

Let's take an example confusion matrix πŸ‘‡
Read 20 tweets

Did Thread Reader help you today?

Support us! We are indie developers!


This site is made by just two indie developers on a laptop doing marketing, support and development! Read more about the story.

Become a Premium Member ($3/month or $30/year) and get exclusive features!

Become Premium

Don't want to be a Premium member but still want to support us?

Make a small donation by buying us coffee ($5) or help with server cost ($10)

Donate via Paypal

Or Donate anonymously using crypto!

Ethereum

0xfe58350B80634f60Fa6Dc149a72b4DFbc17D341E copy

Bitcoin

3ATGMxNzCUFzxpMCHL5sWSt4DVtS8UqXpi copy

Thank you for your support!

Follow Us on Twitter!

:(