Also included:
•Road ahead for COVID vaccination
•BA.2 dominant in England
•Risk of severe outcomes – Omicron v Delta
•Evusheld as vaccine alternative
•More evidence Ivermectin doesn’t improve outcomes
•COVID-19 impact on brain function
Also included:
•Omicron survives longer on surfaces
•Worldwide excess mortality
•Transmissibility comparison – Omicron v Delta
•Infection studies (REACT and ONS)
•ONS antibody levels and COVID mortality
•UKHSA 28-day mortality vs ONS
Also included:
- Booster progress, socio-economic variation and reasons for hesitancy 🏴
- Omicron outcomes in SA 🇿🇦
- Some rapid tests less effective at detecting Omicron
- Vaccination, infection and fertility
- Vaccinated less likely to get Long COVID covidactuaries.org/2022/01/22/the…
Also included:
- EAVE II enables large COVID studies 🏴
- Distribution of anti-virals 🇬🇧
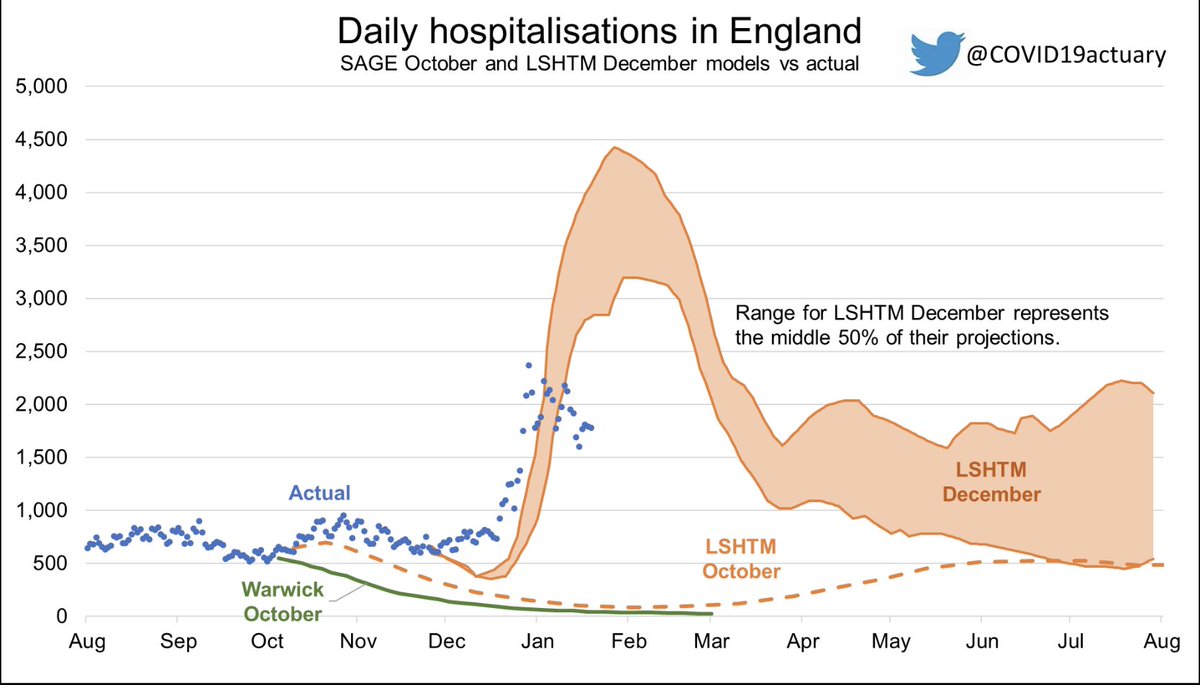
- Hospital admissions vs modelling 🏴
- Global excess mortality 🌍
- @ONS infection and antibody studies 🇬🇧
- Primary diagnosis data 🏴
- 2021 death rates 🏴 🏴 covidactuaries.org/2022/01/22/the…
Update on COVID-19 admissions, occupancy and deaths in English hospitals.
Nationally, admissions with COVID have fallen by 11% week-on-week, with significant falls in every region. Fastest fall in the North West (down 20%) and slowest in the South West (down 6%). 1/4
This chart compares actual hospital admissions with modelled scenarios produced by SPI-M-O teams, including an update from @cmmid_lshtm to incorporate Omicron. Assuming no further uptick in admissions the peak will be significantly lower than the central modelled scenarios. 2/4
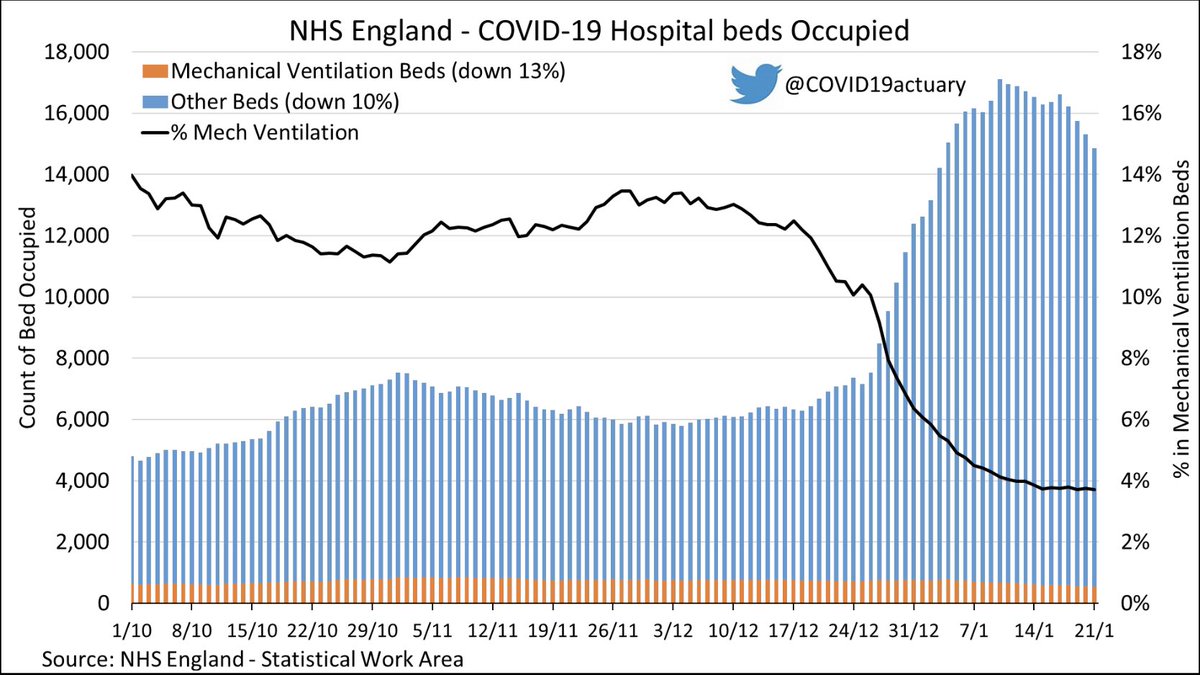
COVID-19 hospital bed occupancy in England is back below 15,000 beds occupied. Mechanical Ventilation bed occupancy is down by 13% week-on-week, while other bed occupancy is down 10%. The proportion of COVID patients in mechanical ventilation beds is the lowest it has been. 3/4
The Continuous Mortality Investigation (CMI) has published its first Mortality Monitor of 2022. It covers to 7 January (week 1).
There were 7% more deaths this week than if death rates were the same as week 1 of 2019. That is 784 excess deaths in England and Wales this week.
CMI calculates 121,300 excess deaths in the UK since the start of the pandemic, of which 900 occurred in 2022.
Cumulative mortality YTD is 0.4% of a full year's mortality below 2019. The cumulative measure compares the first 7 days of each year rather than ISO weeks used above.
As has been the case for around the last six months, the number of excess deaths calculated by the CMI was reasonably similar to the number of deaths with COVID on the death certificate this week.
Tomorrow will see the publication of the first weekly death registrations update of 2022.
There is much interest in the extent to which Omicron is leading to excess deaths when compared to past winters. But how should the excess be calculated?
In a new blog @john_actuary looks at statements from @ONS and the CMI (part of @actuarynews) about the benchmark against which 2022 excess deaths will be calculated.
What sounds like a technical issue is highly significant. The ONS change will mean 11,000 fewer excess deaths.
ONS will update their benchmark so that they are taking the average of deaths in 2016-19 and 2021. Previously they used 2015-19. The chart below shows significant differences in the number of deaths “expected” each week using different choices of benchmark.
A fuller update on hospitals in England today, including admissions by age and hospital deaths.
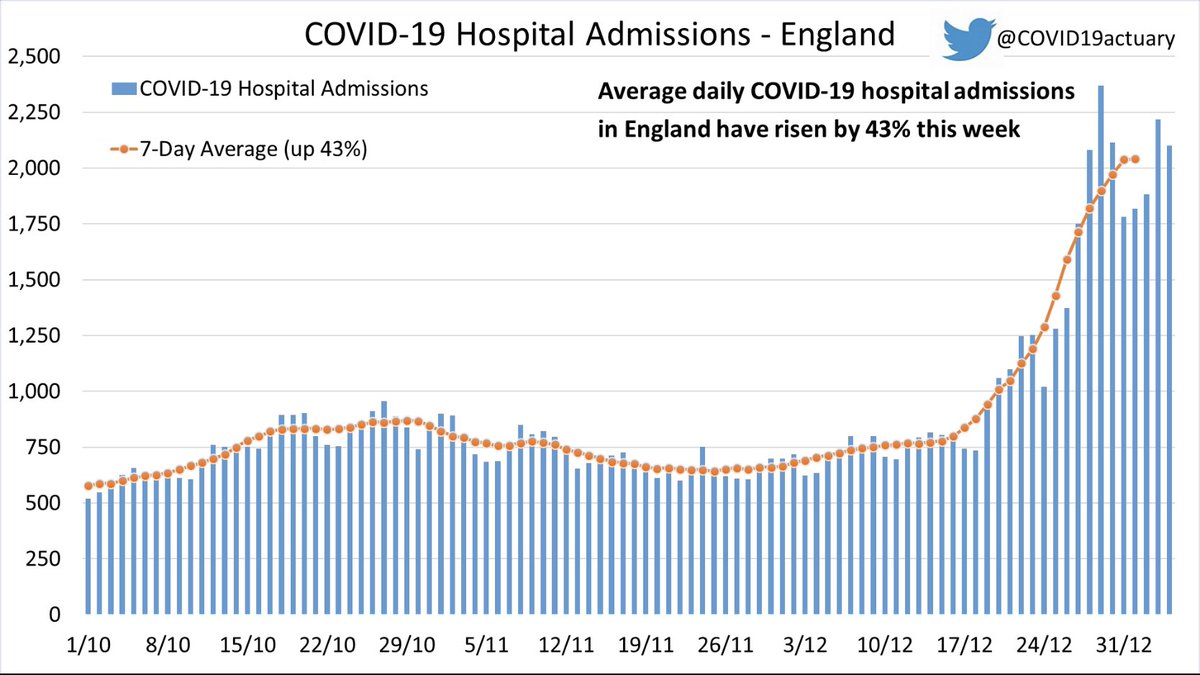
Nationally, admissions with COVID are up by 43% week-on-week, but the rate of growth has slowed significantly. Today’s total is very similar to the total reported a week ago. 1/6
The regional picture is very mixed but growth has been slower everywhere. The change is most pronounced in London, where the 7-day average has fallen in recent days. The fastest growth has been the North West, up 84%. 2/6
Breaking down admissions by age, the 18-64 age group has fallen in the last few days. The older age groups are still increasing but there are signs that the pace has slowed for these too. 3/6