
Companies invest a lot in analytics - but are these investments valuable?
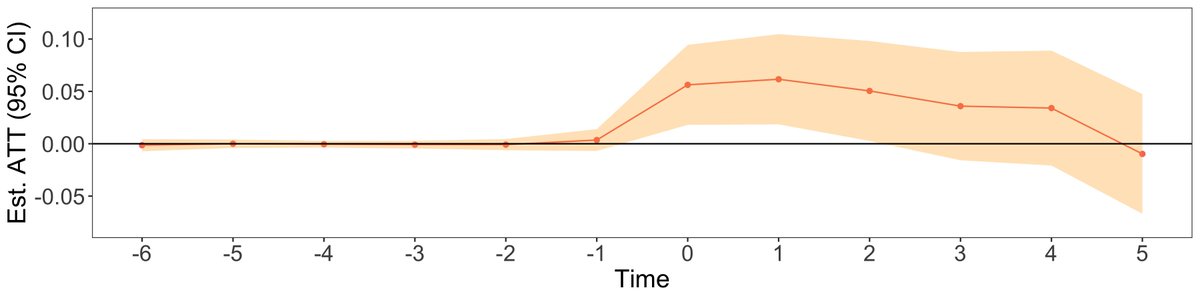
@IsraeliAyelet and I studied ~1,500 online retailers and found that using a descriptive dashboard increased their weekly revenues by 4%-10%.
>>
#MarTech #BigData #Analytics #ecommerce #DataScience
@IsraeliAyelet and I studied ~1,500 online retailers and found that using a descriptive dashboard increased their weekly revenues by 4%-10%.
>>
#MarTech #BigData #Analytics #ecommerce #DataScience
The paper is forthcoming in Marketing Science and is available at pubsonline.informs.org/doi/10.1287/mk….
(Ungated version at dx.doi.org/10.2139/ssrn.3…)
>>
@MarketngScience
(Ungated version at dx.doi.org/10.2139/ssrn.3…)
>>
@MarketngScience
We used data from over 1,500 small and medium ecommerce global sellers (with mostly Shopify stores) with average monthly revenues of ~$60K.
Every retailer adopted an analytics dashboard that displayed KPIs such as weekly sales, avg basket size, conversion rate etc.
>>
Every retailer adopted an analytics dashboard that displayed KPIs such as weekly sales, avg basket size, conversion rate etc.
>>

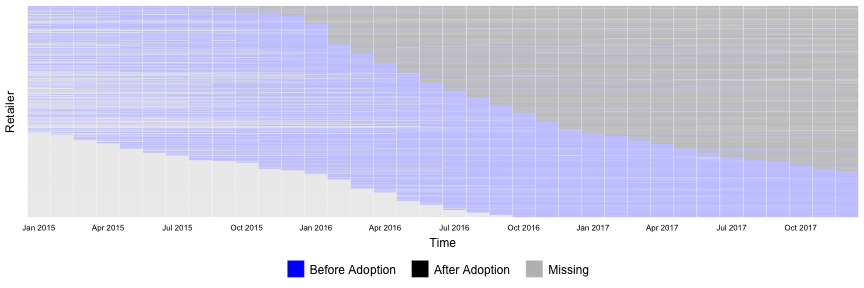
When the retailer adopted the dashboard, the dashboard’s provider also collected historical data, so we see performance before and after the adoption.
Because the dashboard was adopted in different times, the adoption is staggered, which you know what it means… 🙀🙀🙀
>>
Because the dashboard was adopted in different times, the adoption is staggered, which you know what it means… 🙀🙀🙀
>>
Cue in TWFE DiD, Synthetic controls and what not.
Special quirk - our retailers have different time trends and potentially endogenous adoption timing.
Solution was a combination of @jmwooldridge’s POLS regression, @ArkhangelskyD et al. SynthDiD, and an IV.
Special quirk - our retailers have different time trends and potentially endogenous adoption timing.
Solution was a combination of @jmwooldridge’s POLS regression, @ArkhangelskyD et al. SynthDiD, and an IV.


Luckily, all these methods showed the same converging results, which are that adopting the descriptive dashboard yields an increase in revenues, diversity of products sold, number of repeat customers and number of transactions.
As usual, causality disclaimers apply.
>>
As usual, causality disclaimers apply.
>>
But can we say more about whether the descriptive dashboard causes these effects? And if so, how?
A cool and unique feature of our data is that we observe if the retailer actually _use_ the dashboard - do they login to look at reports and when.
>>
A cool and unique feature of our data is that we observe if the retailer actually _use_ the dashboard - do they login to look at reports and when.
>>
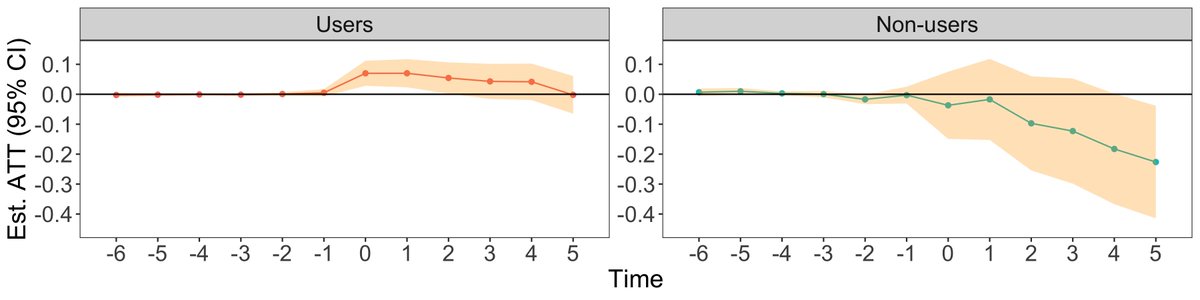
By comparing the results of dashboard users to non-users, we see that only users reap the benefit from the dashboard.
This allows us to rule out improved performance due to an unobserved and unrelated mechanism.
>>
This allows us to rule out improved performance due to an unobserved and unrelated mechanism.
>>
Next, we investigate if the retailers learn directly from the dashboard.
We initially hypothesized that retailers are most likely to change pricing and advertising strategies based on the dashboard KPIs.
Surprisingly, we find that retailers do not change these strategies.
>>
We initially hypothesized that retailers are most likely to change pricing and advertising strategies based on the dashboard KPIs.
Surprisingly, we find that retailers do not change these strategies.
>>
Instead, descriptive analytics serve to help retailers monitor additional marketing technologies (martech) and amplify their value.
Most retailers adopt additional technologies, but only the retailers that use the dashboard are able to benefit from them.
>>
Most retailers adopt additional technologies, but only the retailers that use the dashboard are able to benefit from them.
>>
For example, we see that many retailers adopt CRM, personalization, and prospecting martech. But only those who use the dashboard, experience the benefits of the increase in diversity of products sold, increased transactions, and increased revenue from repeat customers.
>>
>>


Why are descriptive analytics so popular then?
Although they often leave users to generate their own insights, they provide a simple way to assess different decisions, enabling managers to extend the range of actions they can take and to integrate new technologies.
>>
Although they often leave users to generate their own insights, they provide a simple way to assess different decisions, enabling managers to extend the range of actions they can take and to integrate new technologies.
>>
We would like to especially thank @avicgoldfarb who led a very constructive review process for the paper.
• • •
Missing some Tweet in this thread? You can try to
force a refresh


