The value of possession (or otherwise). The chart below shows the rate of chances created vs average possession, so far in this season’s @SkyBetChamp. Top left corner is reserved for the true ‘wasters’ of possession. @QPR are nowhere near @SwansOfficial levels, but of the… #QPR
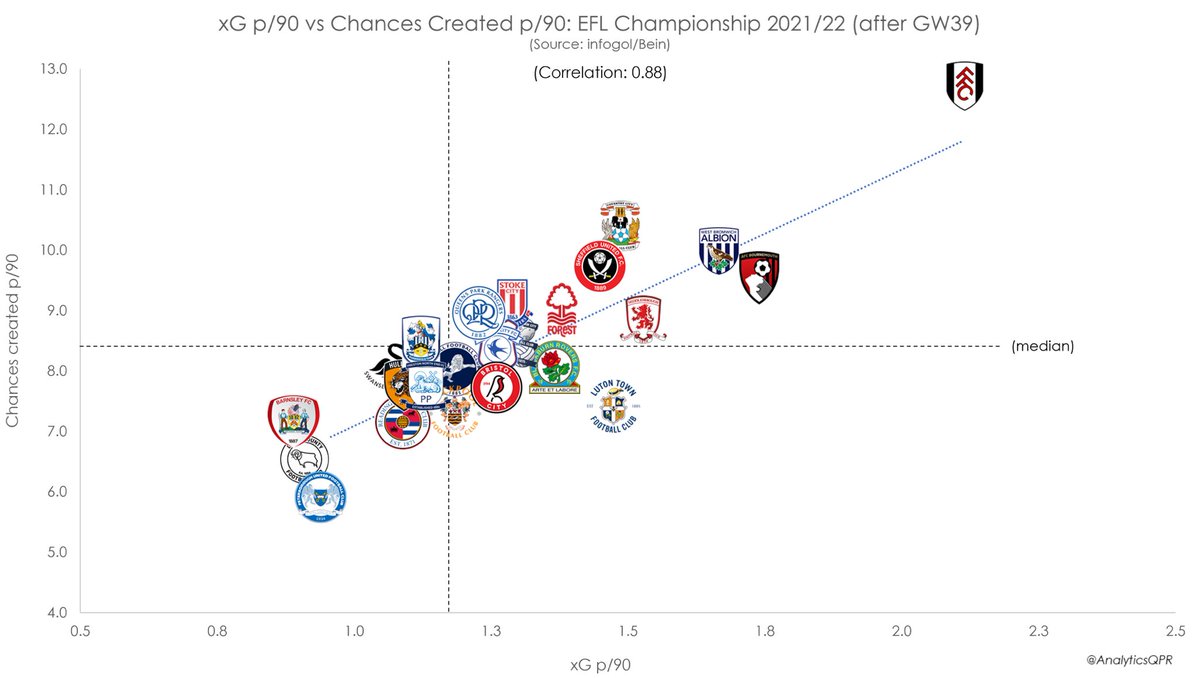
…other high-possession teams, they are a little more pedestrian in terms of chances created. Chart below shows rates of chances created vs xG (there’s obviously a very strong correlation here). Another chart distorted by @FulhamFC, so let’s illustrate in another way… #QPR
The table below is ranked by the rate of chances created. The xG is colour-coded which makes it easier to show who’s over/under performing. @QPR on the low side of xG based on their rate of chances created, so the inference would be that we’re not creating ‘good’ chances… #QPR
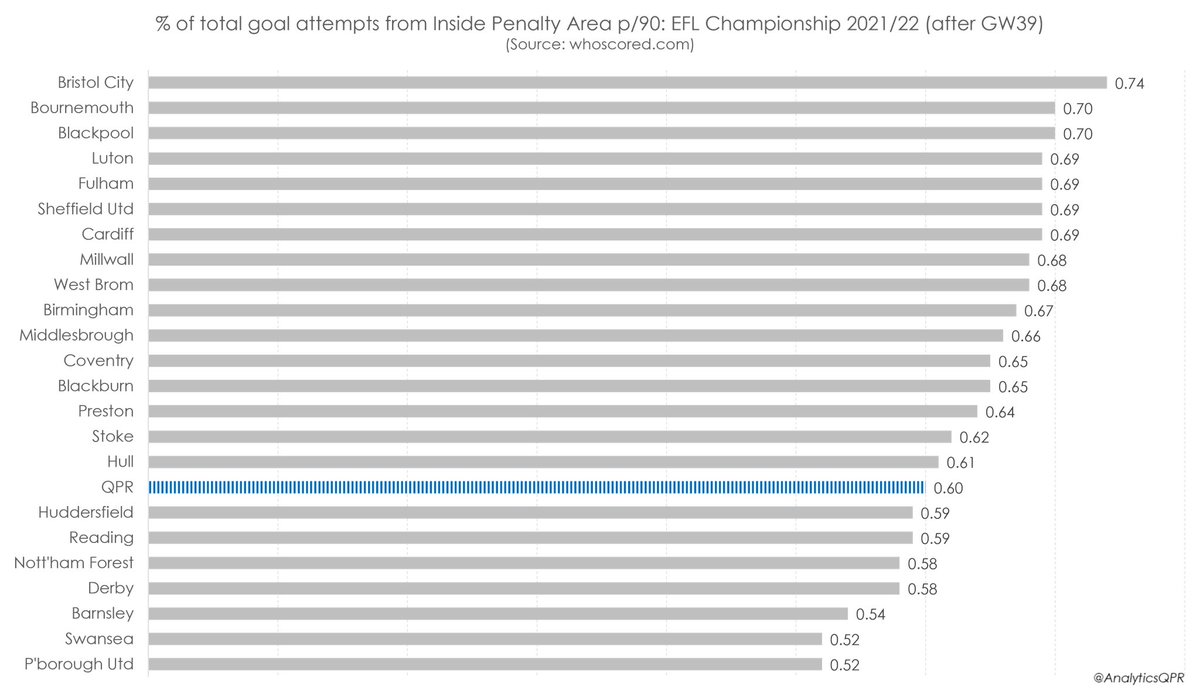
#QPR are actually fairly ordinary in terms of attacking attempts from inside the penalty area. Whilst QPR currently rank 7th for attempts on goal, 40% of these are from outside of the box. Again, I’d link this to the quality of chances which are being created… #QPR
Unsurprisingly, 60% of goal attempts being from inside the penalty area is on the low side in the @SkyBetChamp… #QPR
At a time when most of QPR’s forward players are actually overachieving vs their respective cat figures, I’d say it’s harsh to constantly lambast them. For me, the problem begins and ends in the overall creativity of the team, including full backs as well as midfielders #QPR
1/ With the playoff teams confirmed for this season, I wanted to look at how many points @QPR need to be targeting in order to break into the top 6 next season... #EFL#QPR
2/ Taking data from the last 5 @SkyBetChamp seasons (including this season, with points per game used to account for 46 matches), we can use logistic regression to determine the probability of finishing in the top 6, based on number of points won... #QPR#EFL
3/ The chart below illustrates this relationship between points and probability of top 6, i.e. if a team achieves 80 points (for example), then they’re almost certain to finish in the top 6. A team will likely need to achieve somewhere around 73 points to give themselves... #QPR
1/ Fancied illustrating how much @QPR have improved in the second half of the season, and in context to the rest of the @SkyBetChamp division. The chart below shows the difference in average goals scored per match between Matches 1-23 & Match 24 onwards... #EFL#QPR
2/ Goals scored per match increased from 0.96 to 1.31. Goals conceded per match (chart below) improved from 1.30 down to 1.00 between those periods. Both charts illustrate that @QPR are one of the most improved teams in the second half of the season... #EFL#QPR
3/ Obviously #QPR still have 7 games to play and things can change between now and the end of the season, but it’s a nice illustration of the improvement nonetheless #EFL@SkyBetChamp
Any reason to be nervous tonight? Shouldn’t be, given that @wwfcofficial are by some distance the worst team in the division. However there’s a sense that this is the sort of team we tend to struggle against... #QPR#QPRWYC
As of Week 35, @wwfcofficial have only scored 23 goals (and 4 of those were penalties). However, 35% of this meagre total were from set-pieces, significantly above the league average of 24%. So if there’s any threat, it’ll likely be from these #QPR#QPRWYC
Despite a massive improvement in our defending this season, @QPR still ship a decent share of goals from set pieces. But, is this enough to make anyone nervous? Against the worst team in the division? #QPR#QPRWYC