Chris Perruna Profile picture
Apr 3 4 tweets 2 min read
🧵March 2022 Portfolio Update:
*through April 3rd

Past Month Performance:
Crypto: +11.9%
IRA Acct: +3.70%
Growth Acct: +1.45%

YTD:
Crypto Act: -3.6%
IRA Act: -9.29% | Fully invested
Growth Act: -11.23% | 80.5% cash

$SPX -4.62%
$COMPQ -8.84%
$ARKK -28.6%
2/ Growth Account Holdings

-11.23% YTD
+1.45% past month
Cash: 80.5%

$PLTR 3.9%
$SQ 3.8%
$COIN 2.6%
$TDOC 2.1%
$SHOP 2.0%
$MQ 2.0%
$ROKU 1.8%
$RBLX 1.3%
3/ IRA Holdings

-9.29% YTD
+3.70% past month
Cash: 0%, fully invested

$AAPL
$AMZN
$COST
$CVS
$DIS
$FB
$GOOGL
$HD
$JNJ
$JPM
$MSFT
$NFLX
$PG
$SBUX
$T
$TDOC
$TGT
$V
$VZ
$WMT

Looking to replace $T
4/ Crypto Holdings

-3.60% YTD
+11.9% past month
+514.8% all-time (started July 2019)

#Bitcoin
#Ethereum
#Solona
#Cardano

• • •

Missing some Tweet in this thread? You can try to force a refresh
 

Keep Current with Chris Perruna

Chris Perruna Profile picture

Stay in touch and get notified when new unrolls are available from this author!

Read all threads

This Thread may be Removed Anytime!

PDF

Twitter may remove this content at anytime! Save it as PDF for later use!

Try unrolling a thread yourself!

how to unroll video
  1. Follow @ThreadReaderApp to mention us!

  2. From a Twitter thread mention us with a keyword "unroll"
@threadreaderapp unroll

Practice here first or read more on our help page!

More from @cperruna

Mar 30
🧵Bear Flag Pattern

Stocks can often gain 100%+ on the move, quickly.

But notice the longer term trend & 200d ma.

Can these 12 beaten down stocks recover the 200d?
If so, how long will it take?

$ARKK is the group example

All 12 are still -35% to -65% below the 200d ma
2/ $PTON
3/ $FSLY
Read 15 tweets
Mar 27
🧵Is a Perfect Storm brewing for a global famine?

"We believe we are at the onset of a global famine of historic proportions."

The populations most at risk... are half a world away & we worry that that number is uncomfortably high.

Must read @DoombergT

doomberg.substack.com/p/farmers-on-t…
2/ Fertilizer prices at record highs!

Key sources of nitrogen, potassium, and phosphorous – important inputs into soil fertility, crop yield, and plant maintenance – have all gone vertical.

Via: @DoombergT
3/ Ammonia is derived directly from natural gas, and the price of natural gas outside of the US has gone vertical.

Glyphosate is effectively little more than an elegantly modified fertilizer, containing both phosphorous and nitrogen.

Via: @DoombergT
Read 8 tweets
Mar 22
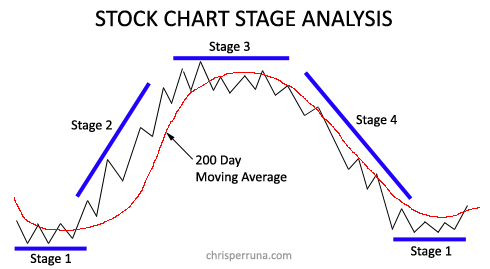
🧵Stock Chart Stage Analysis

5 examples of stocks that just went through stages 2, 3 and 4 (all currently in stage 4).

Ideal Buy: In Stage 2 (above 200d)
Ideal Sell: In Stage 4 (below 200d)

$TDOC
$PTON
$ZM
$RDFN
$ROKU
2/ $TDOC - currently in stage 4, well below the 200d ma.
3/ $PTON - currently in stage 4, well below the 200d ma.
Read 6 tweets
Feb 15
🧵25 Stocks Under the 200d ma

- COVID Growth Stars
- IPO: 2015-'21
- 11% to 52% below respective 200d ma
- Broken charts, need to recover

$ASAN $DOCN $U $NET $APPS $OKTA $CELH $RBLX $CRWD $COIN $SOFI $ETSY $ESTC $SHOP $RDFN $PLTR $UPST $TDOC $DOCU $ROKU $SQ $ZM $DKNG $FVRR $SE
$ASAN - $68.66
-11.4% below the 200d ma
-52.9% off high
38.23 P/S
$DOCN - $59.02
-13.1% below the 200d ma
-55.76% off high
16.25 P/S
Read 26 tweets
Feb 4
Bear Flag in down-trending markets

Just one example but a powerful graphic showing that a stock can have a quick & large move up, following a big pullback.

But notice the longer term trend & 200d ma.

It dropped another 82% after the 100% bounce.

Watch for these in this market Image
It's a common pattern in a bear marker.

I don't know if we're headed towards a bear market but I do know this:

Watch for this bear flag pattern across many names.

If they fail, watch out! Image
Image
Read 7 tweets
Jan 19
1/ Nasdaq with 817 new lows today, the most since March 18, 2020 at 1,698.

And the most since March 9, 2020, when it hit 1,406 (on the front end of that extreme run).

2,097 was peak on March 12th

That extreme run went from March 9th to March 18th

$COMPQ
2/ Look at the Nasdaq daily % change between March 9th and March 27th.

Insane up and down days - this is the exteme flush I often refer to. We haven't had this yet, with regards to the indexes. Growth has had it.

Largest down day: -12.32%
Largest up day: +9.35%
3/ The 2018 $COMPQ lows, for comparison
Read 5 tweets

Did Thread Reader help you today?

Support us! We are indie developers!


This site is made by just two indie developers on a laptop doing marketing, support and development! Read more about the story.

Become a Premium Member ($3/month or $30/year) and get exclusive features!

Become Premium

Don't want to be a Premium member but still want to support us?

Make a small donation by buying us coffee ($5) or help with server cost ($10)

Donate via Paypal

Or Donate anonymously using crypto!

Ethereum

0xfe58350B80634f60Fa6Dc149a72b4DFbc17D341E copy

Bitcoin

3ATGMxNzCUFzxpMCHL5sWSt4DVtS8UqXpi copy

Thank you for your support!

Follow Us on Twitter!

:(